Dal 1996 la Banca d'Italia realizza un'indagine campionaria sul turismo internazionale con l'obiettivo primario di acquisire informazioni per la compilazione sia della voce "Viaggi" (che include i beni e i servizi acquistati da persone fisiche in paesi in cui non sono residenti, in relazione a viaggi in tali paesi), sia della voce "Trasporti internazionali di passeggeri" della bilancia dei pagamenti dell'Italia, in linea con le convenzioni metodologiche previste dal sesto manuale del FMI (BPM6). L'indagine è basata su interviste e conteggi di viaggiatori residenti e non residenti in transito alle frontiere italiane (valichi stradali e ferroviari, porti e aeroporti internazionali) e viene integrata con l'utilizzo di dati amministrativi, ove disponibili, e, dalla fine del 2020, con dati di telefonia mobile.
Grazie all'ampia gamma di dati analitici aggiuntivi rispetto alle esigenze della bilancia dei pagamenti, l'indagine sul turismo costituisce una ricca base informativa per gli operatori del settore e per la ricerca; i dati sono disponibili in questo sito sia in forma aggregata sia a livello di microdati.
Aggiornamento mensile sul turismo internazionale
Lo scorso marzo il saldo della bilancia dei pagamenti turistica dell’Italia è risultato in avanzo di 0,5 miliardi di euro, come nello stesso mese del 2025. Sia la spesa dei viaggiatori stranieri in Italia (3,1 miliardi) sia quella dei viaggiatori italiani all’estero (2,6 miliardi) sono lievemente diminuite nel confronto con marzo 2025 (entrambe di quasi l’1 per cento).
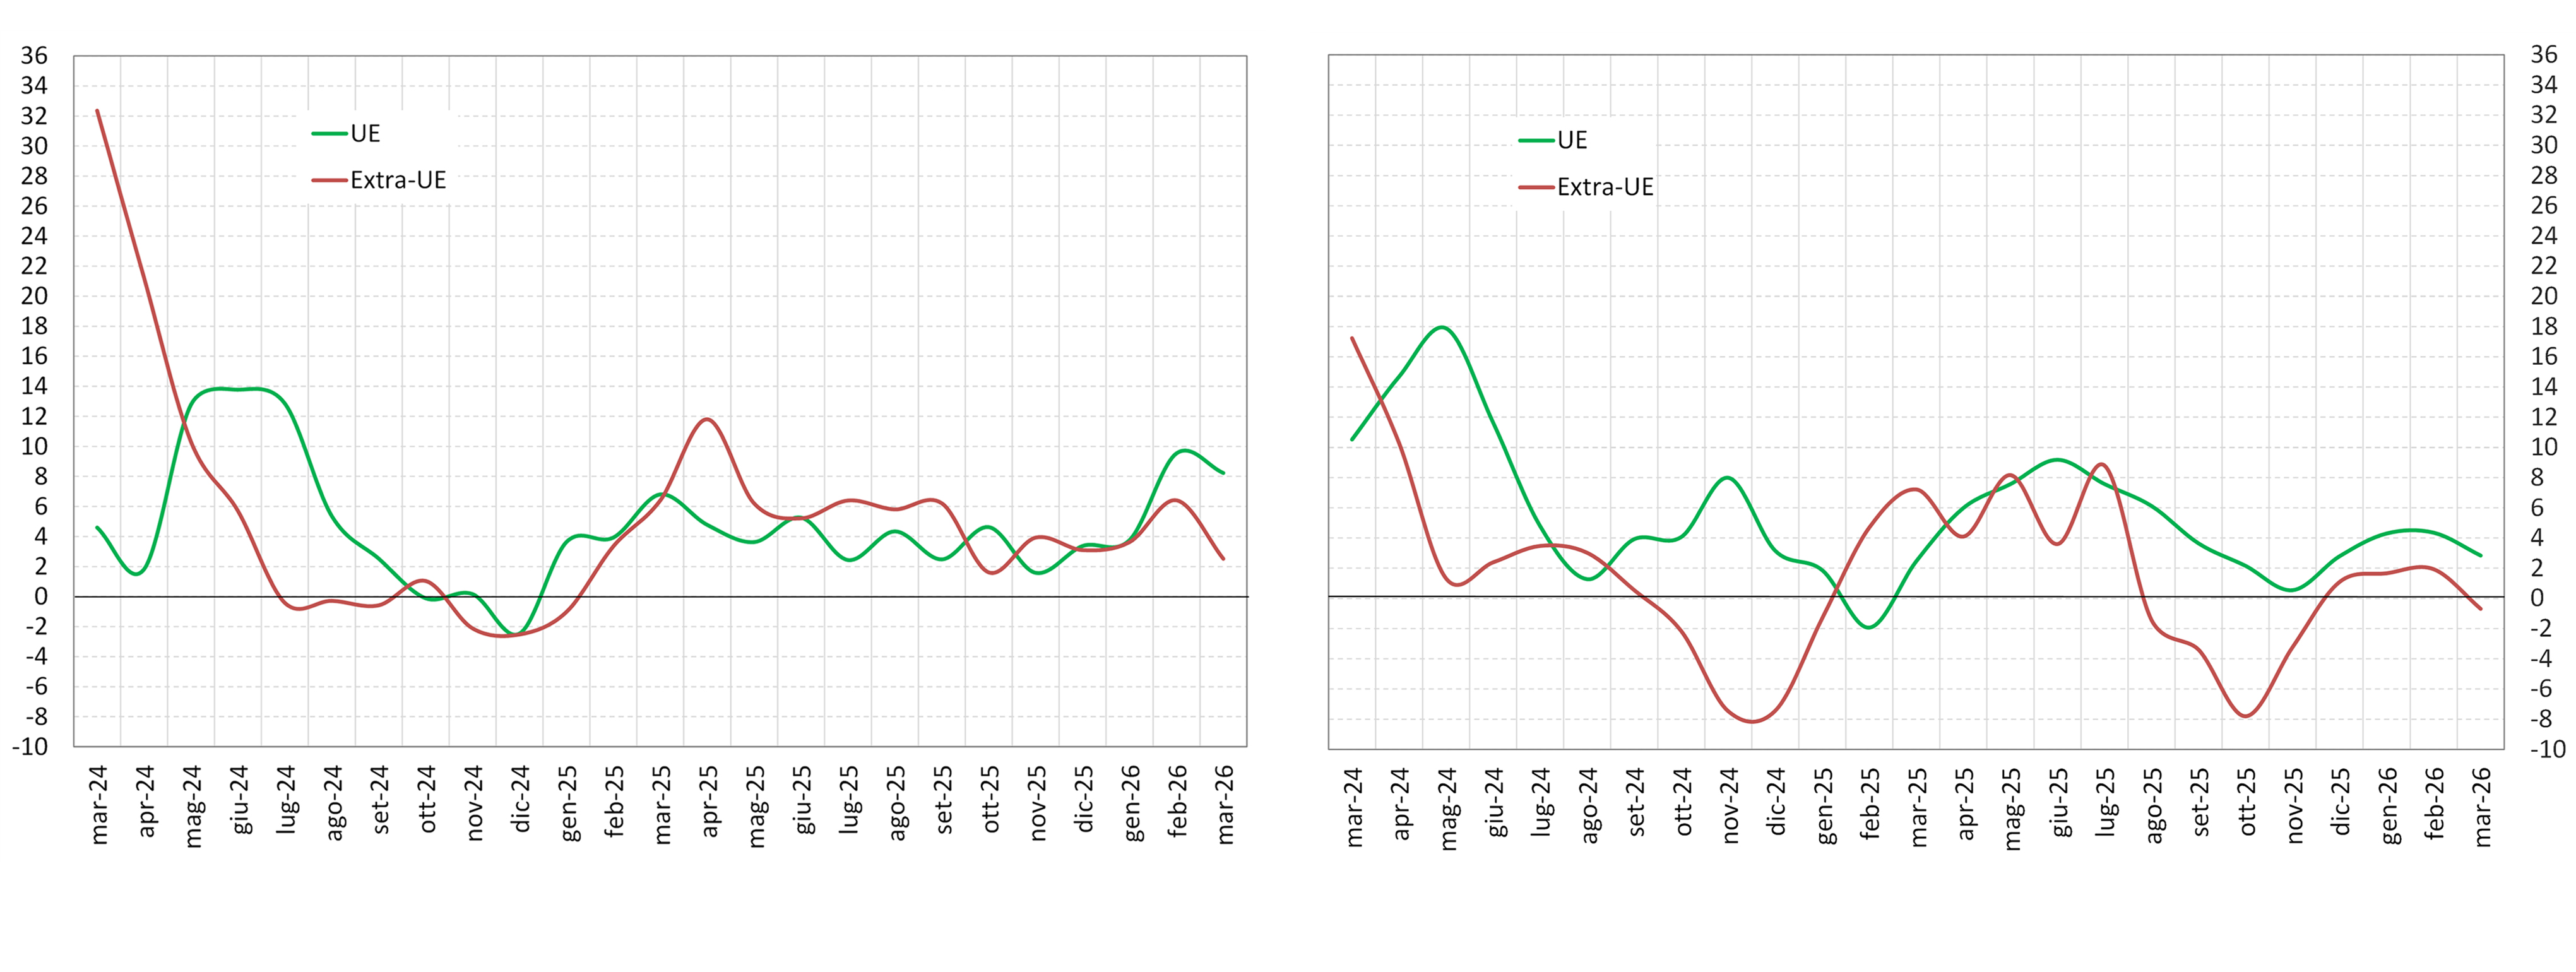
Nel complesso del primo trimestre del 2026 i flussi hanno registrato un incremento rispetto allo stesso periodo dell’anno precedente (Fig. 1), significativo per le entrate (5,4 per cento) e di modesta entità per le uscite (0,6 per cento), in entrambi i casi dovuto principalmente all’aumento dei viaggi per vacanze. La spesa degli stranieri in Italia ha beneficiato in particolare dell’incremento del numero di viaggiatori (legato alle Olimpiadi invernali), a fronte di una marginale crescita dei pernottamenti e una spesa pro-capite stabile; anche l’ampliamento della spesa degli italiani all’estero è stato sostenuto dal maggior numero di viaggiatori, che però è stato in larga parte compensato da una minore spesa pro-capite. La crescita delle entrate turistiche è dovuta in misura più consistente ai viaggiatori provenienti dai paesi UE rispetto a quelli extra-UE (rispettivamente, 8,2 e 2,5 per cento; Fig. 2, pannello di sinistra). Le uscite turistiche hanno registrato un incremento nelle destinazioni UE (2,8 per cento) e una modesta flessione in quelle extra-UE (-0,7 per cento; Fig. 2, pannello di destra).
Fig. 1 - Spesa turistica dei viaggiatori internazionali
(medie mobili di 3 mesi; variazioni percentuali sul corrispondente periodo dell'anno precedente)
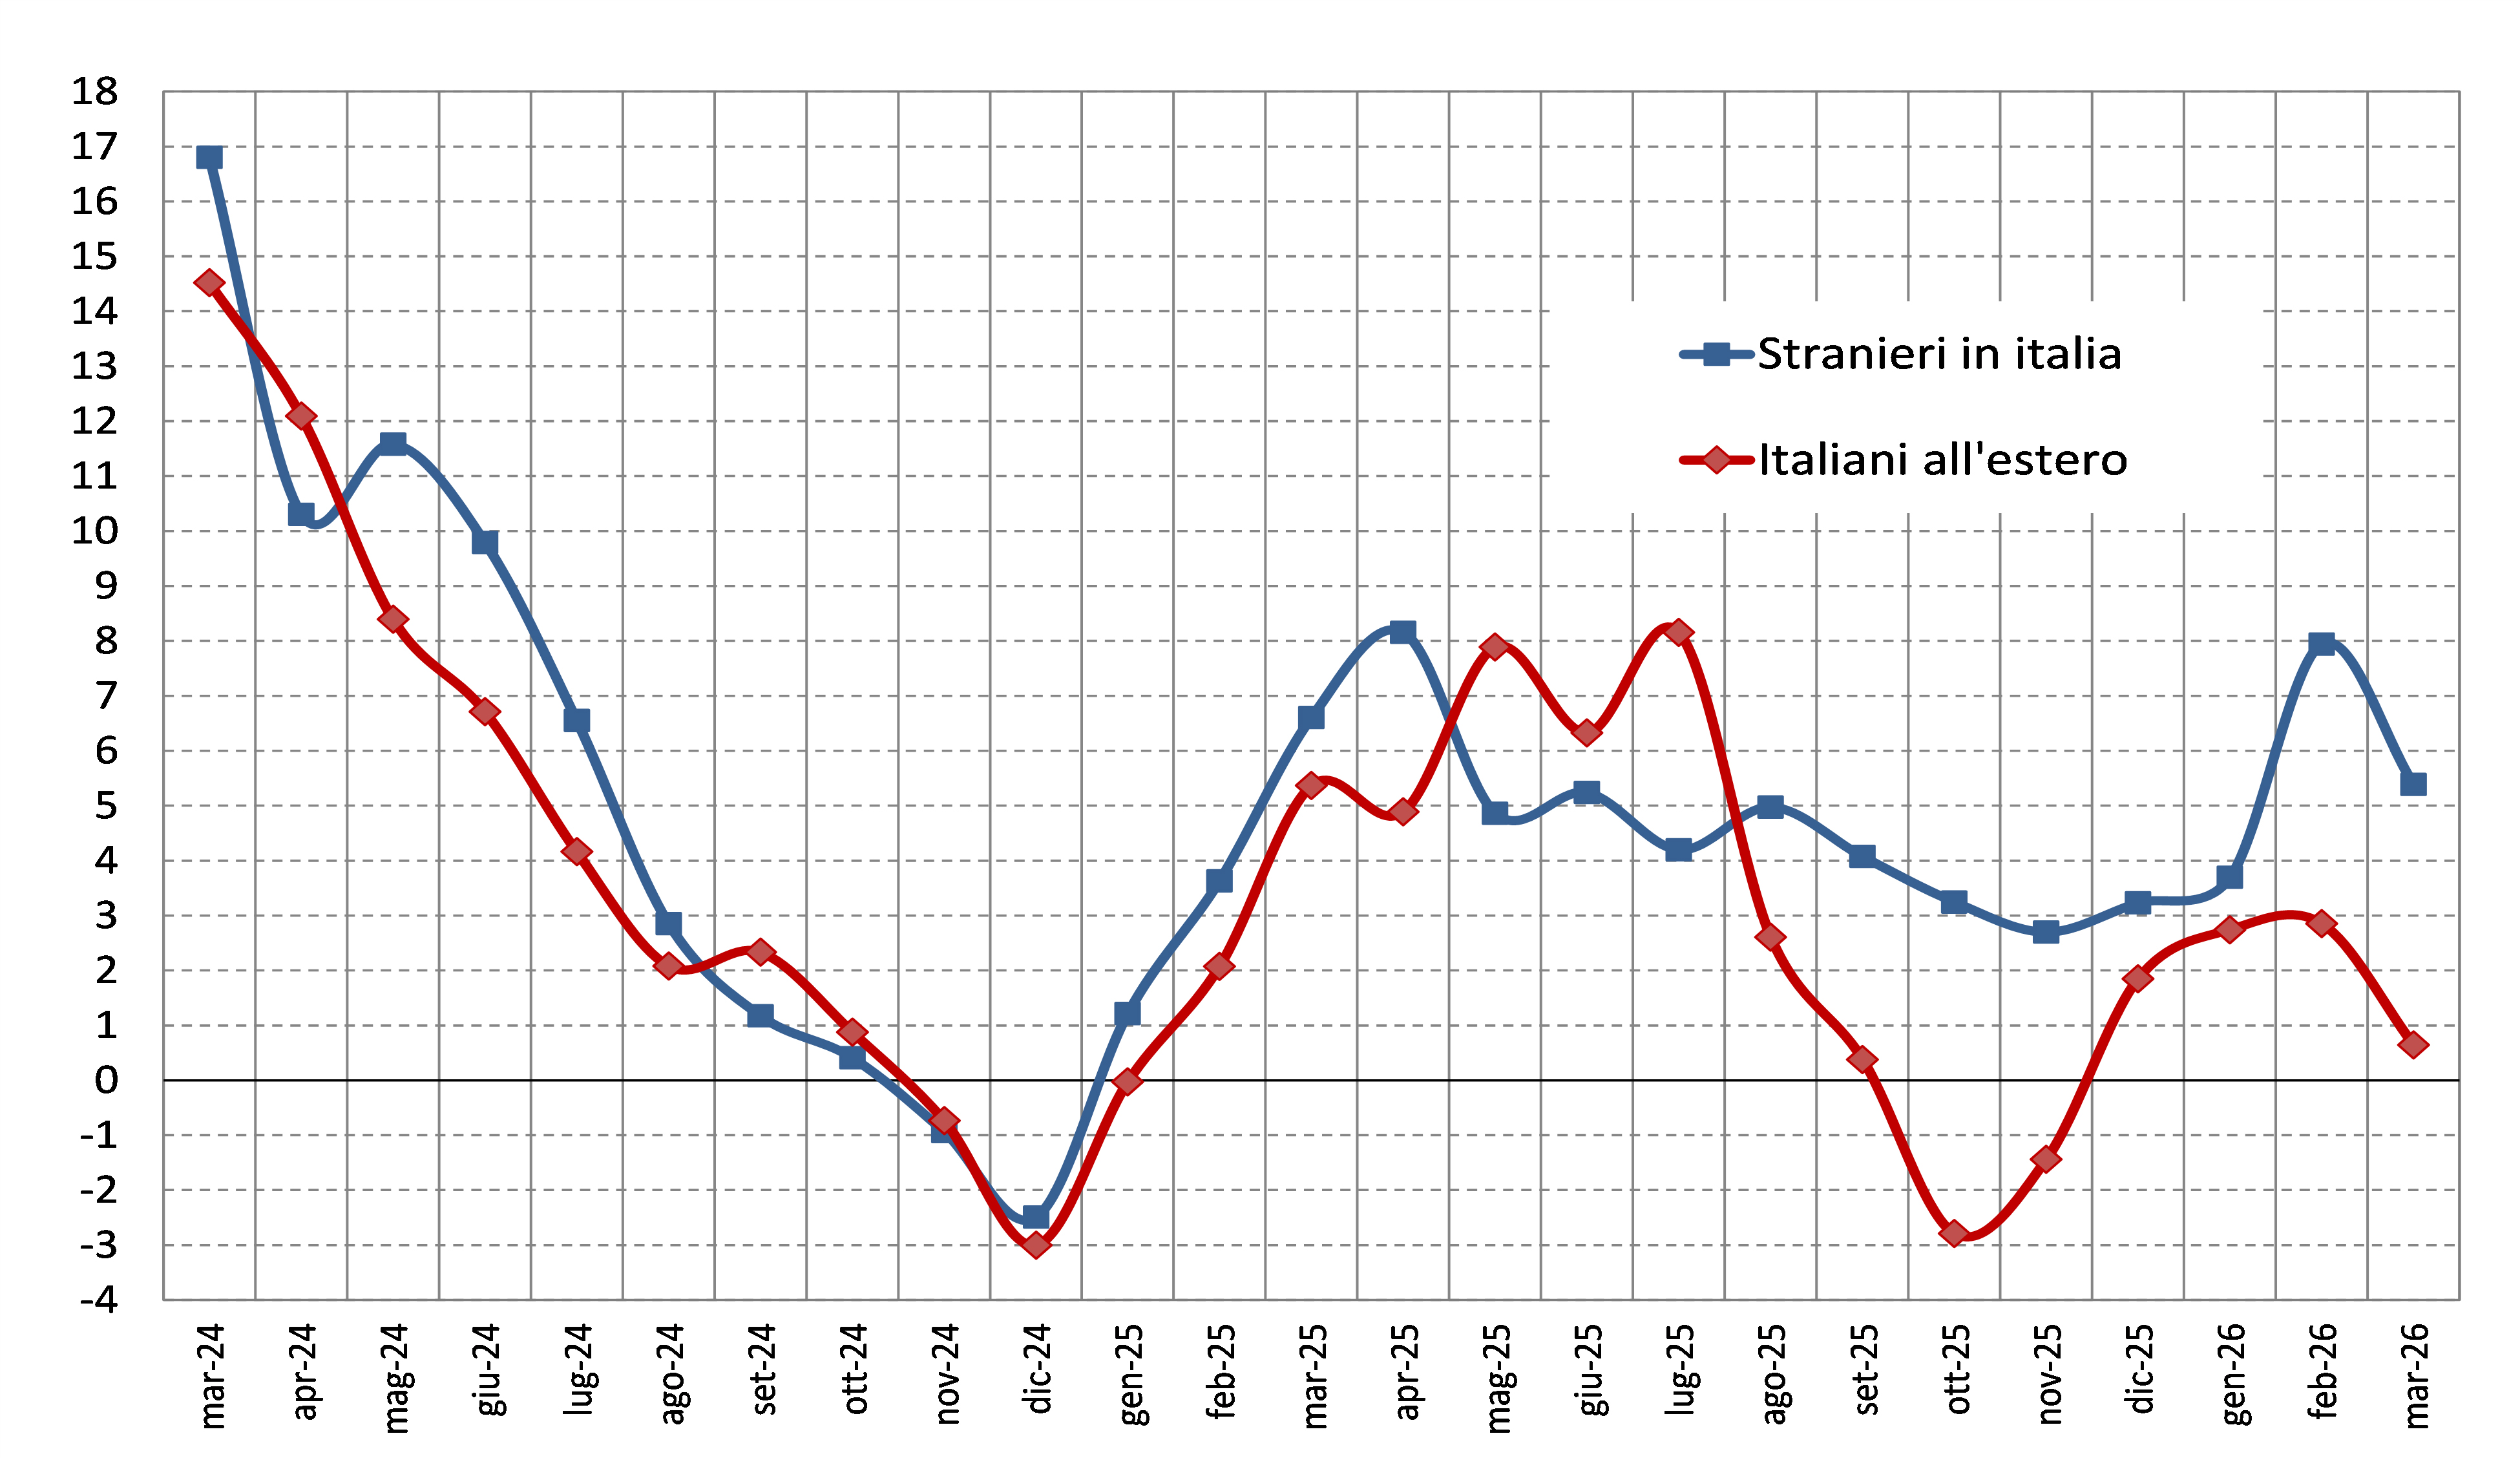
Fig. 2 - Spesa turistica dei viaggiatori internazionali: dettaglio geografico
(medie mobili di 3 mesi; variazioni percentuali sul corrispondente periodo dell'anno precedente)
 Instagram