Banca d'Italia has been conducting since 1996 a survey on international tourism primarily to collect information for compiling the 'Travel' item (which includes goods and services acquired from an economy by non-residents during visits to that economy) and the 'Passenger transport services' item in Italy's balance of payments, in line with the methodological conventions laid out in the sixth edition of the IMF's manual (BPM6). The survey is based on interviews and counts of resident and non-resident travellers at the Italian borders (road and rail crossings, international ports and airports); it is integrated with administrative data and, since end-2020, with mobile phone data, where available.
The survey also serves as a useful database for operators in the tourism sector and researchers, thanks to the wide range of analytical data provided alongside those gathered strictly for balance of payment requirements. The data are available on this website both in aggregate form and as microdata.
Monthly brief on international tourism
Last March, Italy’s tourism balance of payments recorded a surplus of €0.5 billion, unchanged from the same month in 2025. Both inbound tourism expenditure (€3.1 billion) and outbound tourism expenditures (€2.6 billion) declined slightly compared with March 2025 (by almost 1 per cent in both cases).
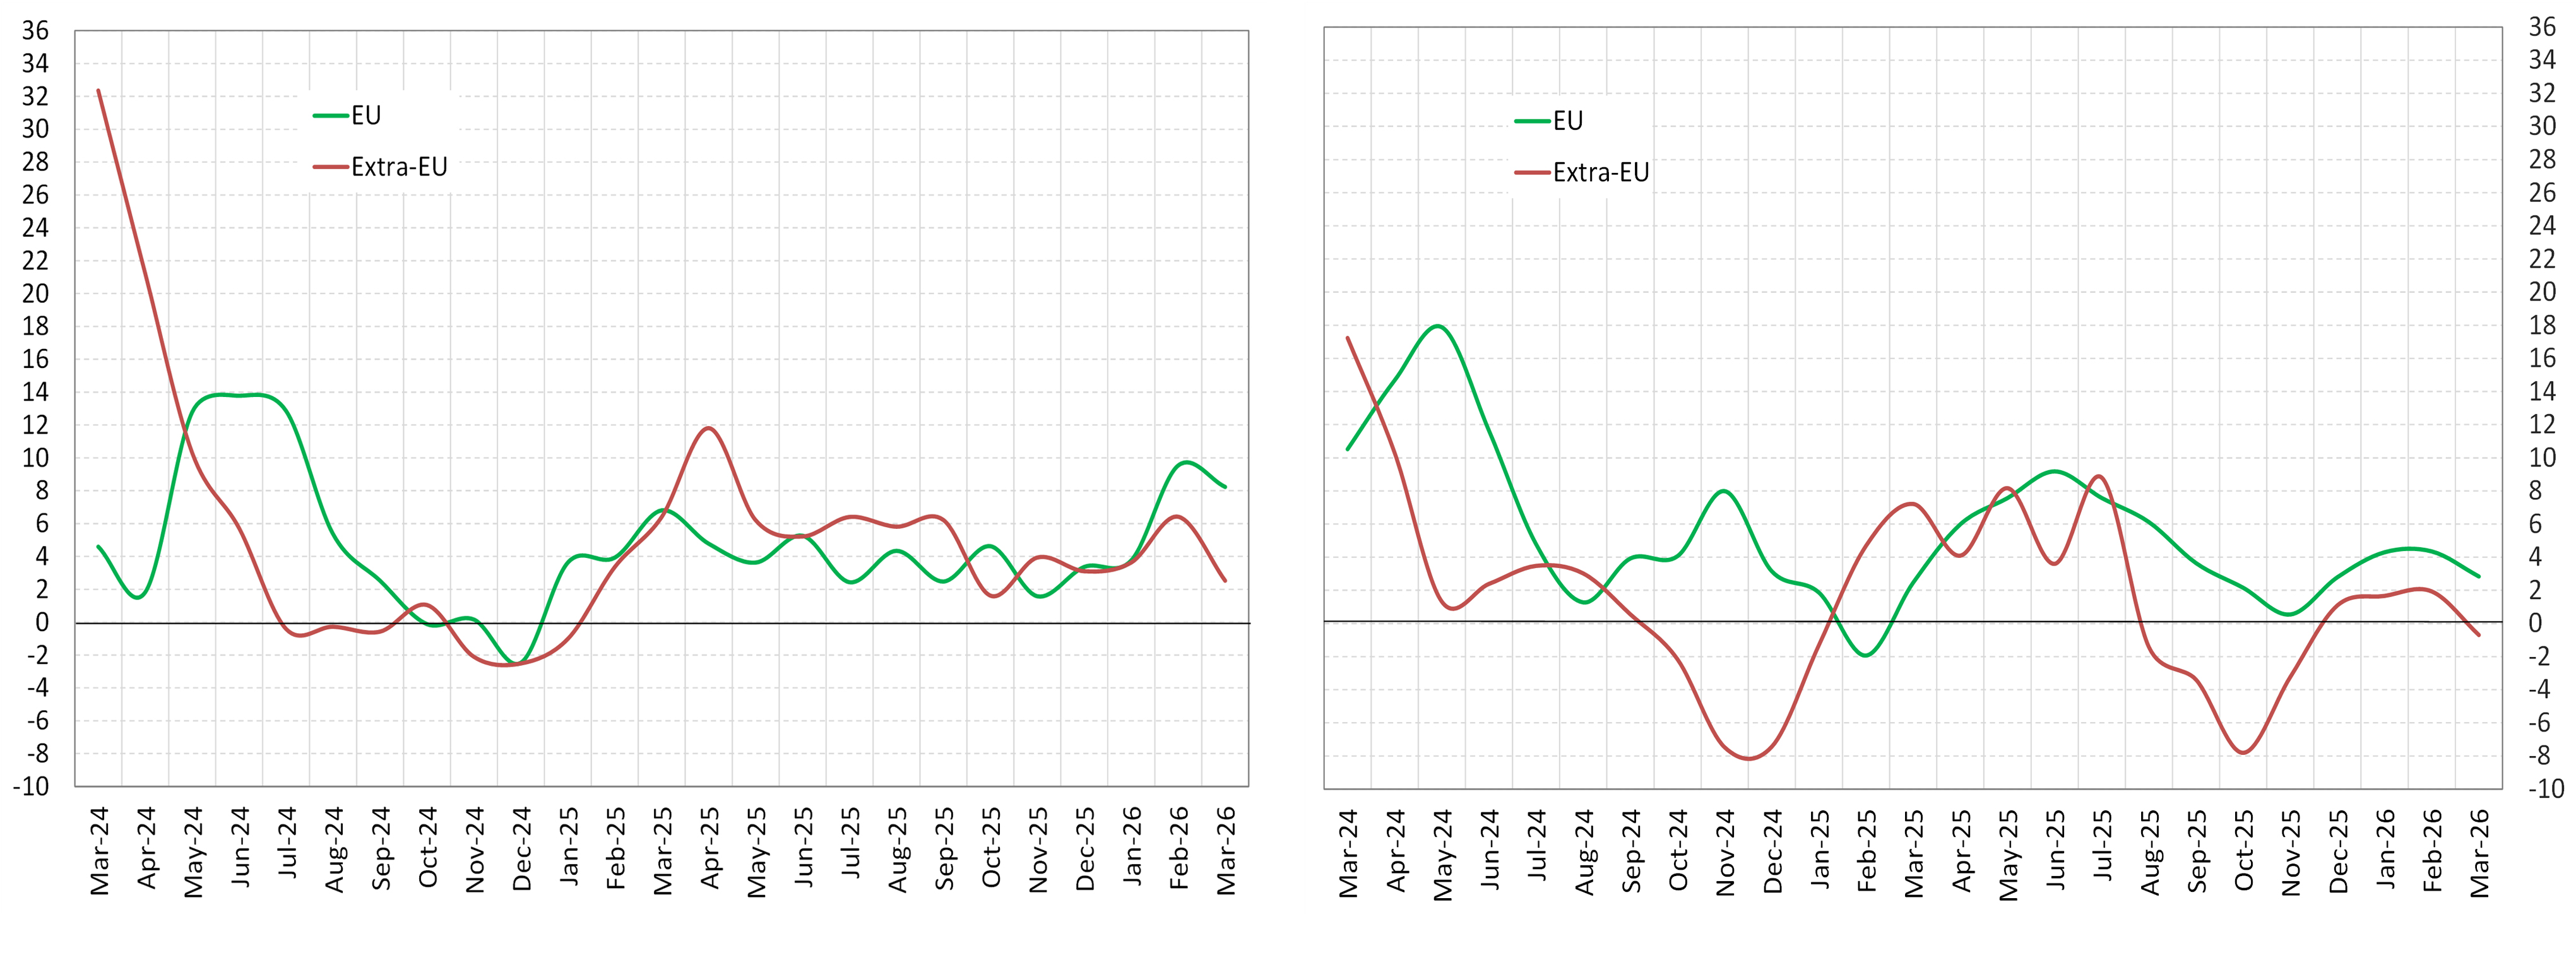
For the three-month period ending in March 2026, travel flows increased relative to the same period of the previous year (Fig. 1). The rise was significant for receipts (5.4 per cent) and more modest for expenditure (0.6 per cent), in both cases mainly driven by an increase in holiday travel. Spending by foreign travellers in Italy benefited from a higher number of visitors (linked to the Winter Olympic Games), while overnight stays increased only marginally and per-capita spending remained broadly stable. The increase in Italians’ spending abroad was also supported by a larger number of travellers, although this was largely offset by lower per-capita expenditure. Growth in tourism receipts was driven more strongly by travellers from EU countries than by those from outside the EU (8.2 per cent and 2.5 per cent, respectively; Fig. 2, left panel). Travel expenditure abroad increased for trips to EU destinations (2.8 per cent) and declined slightly for non-EU destinations (-0.7 per cent; Figure 2, right panel).
Fig. 1 - Italy's inbound and outbound tourism expenditure
(3-month moving averages; year-on-year percentage changes)
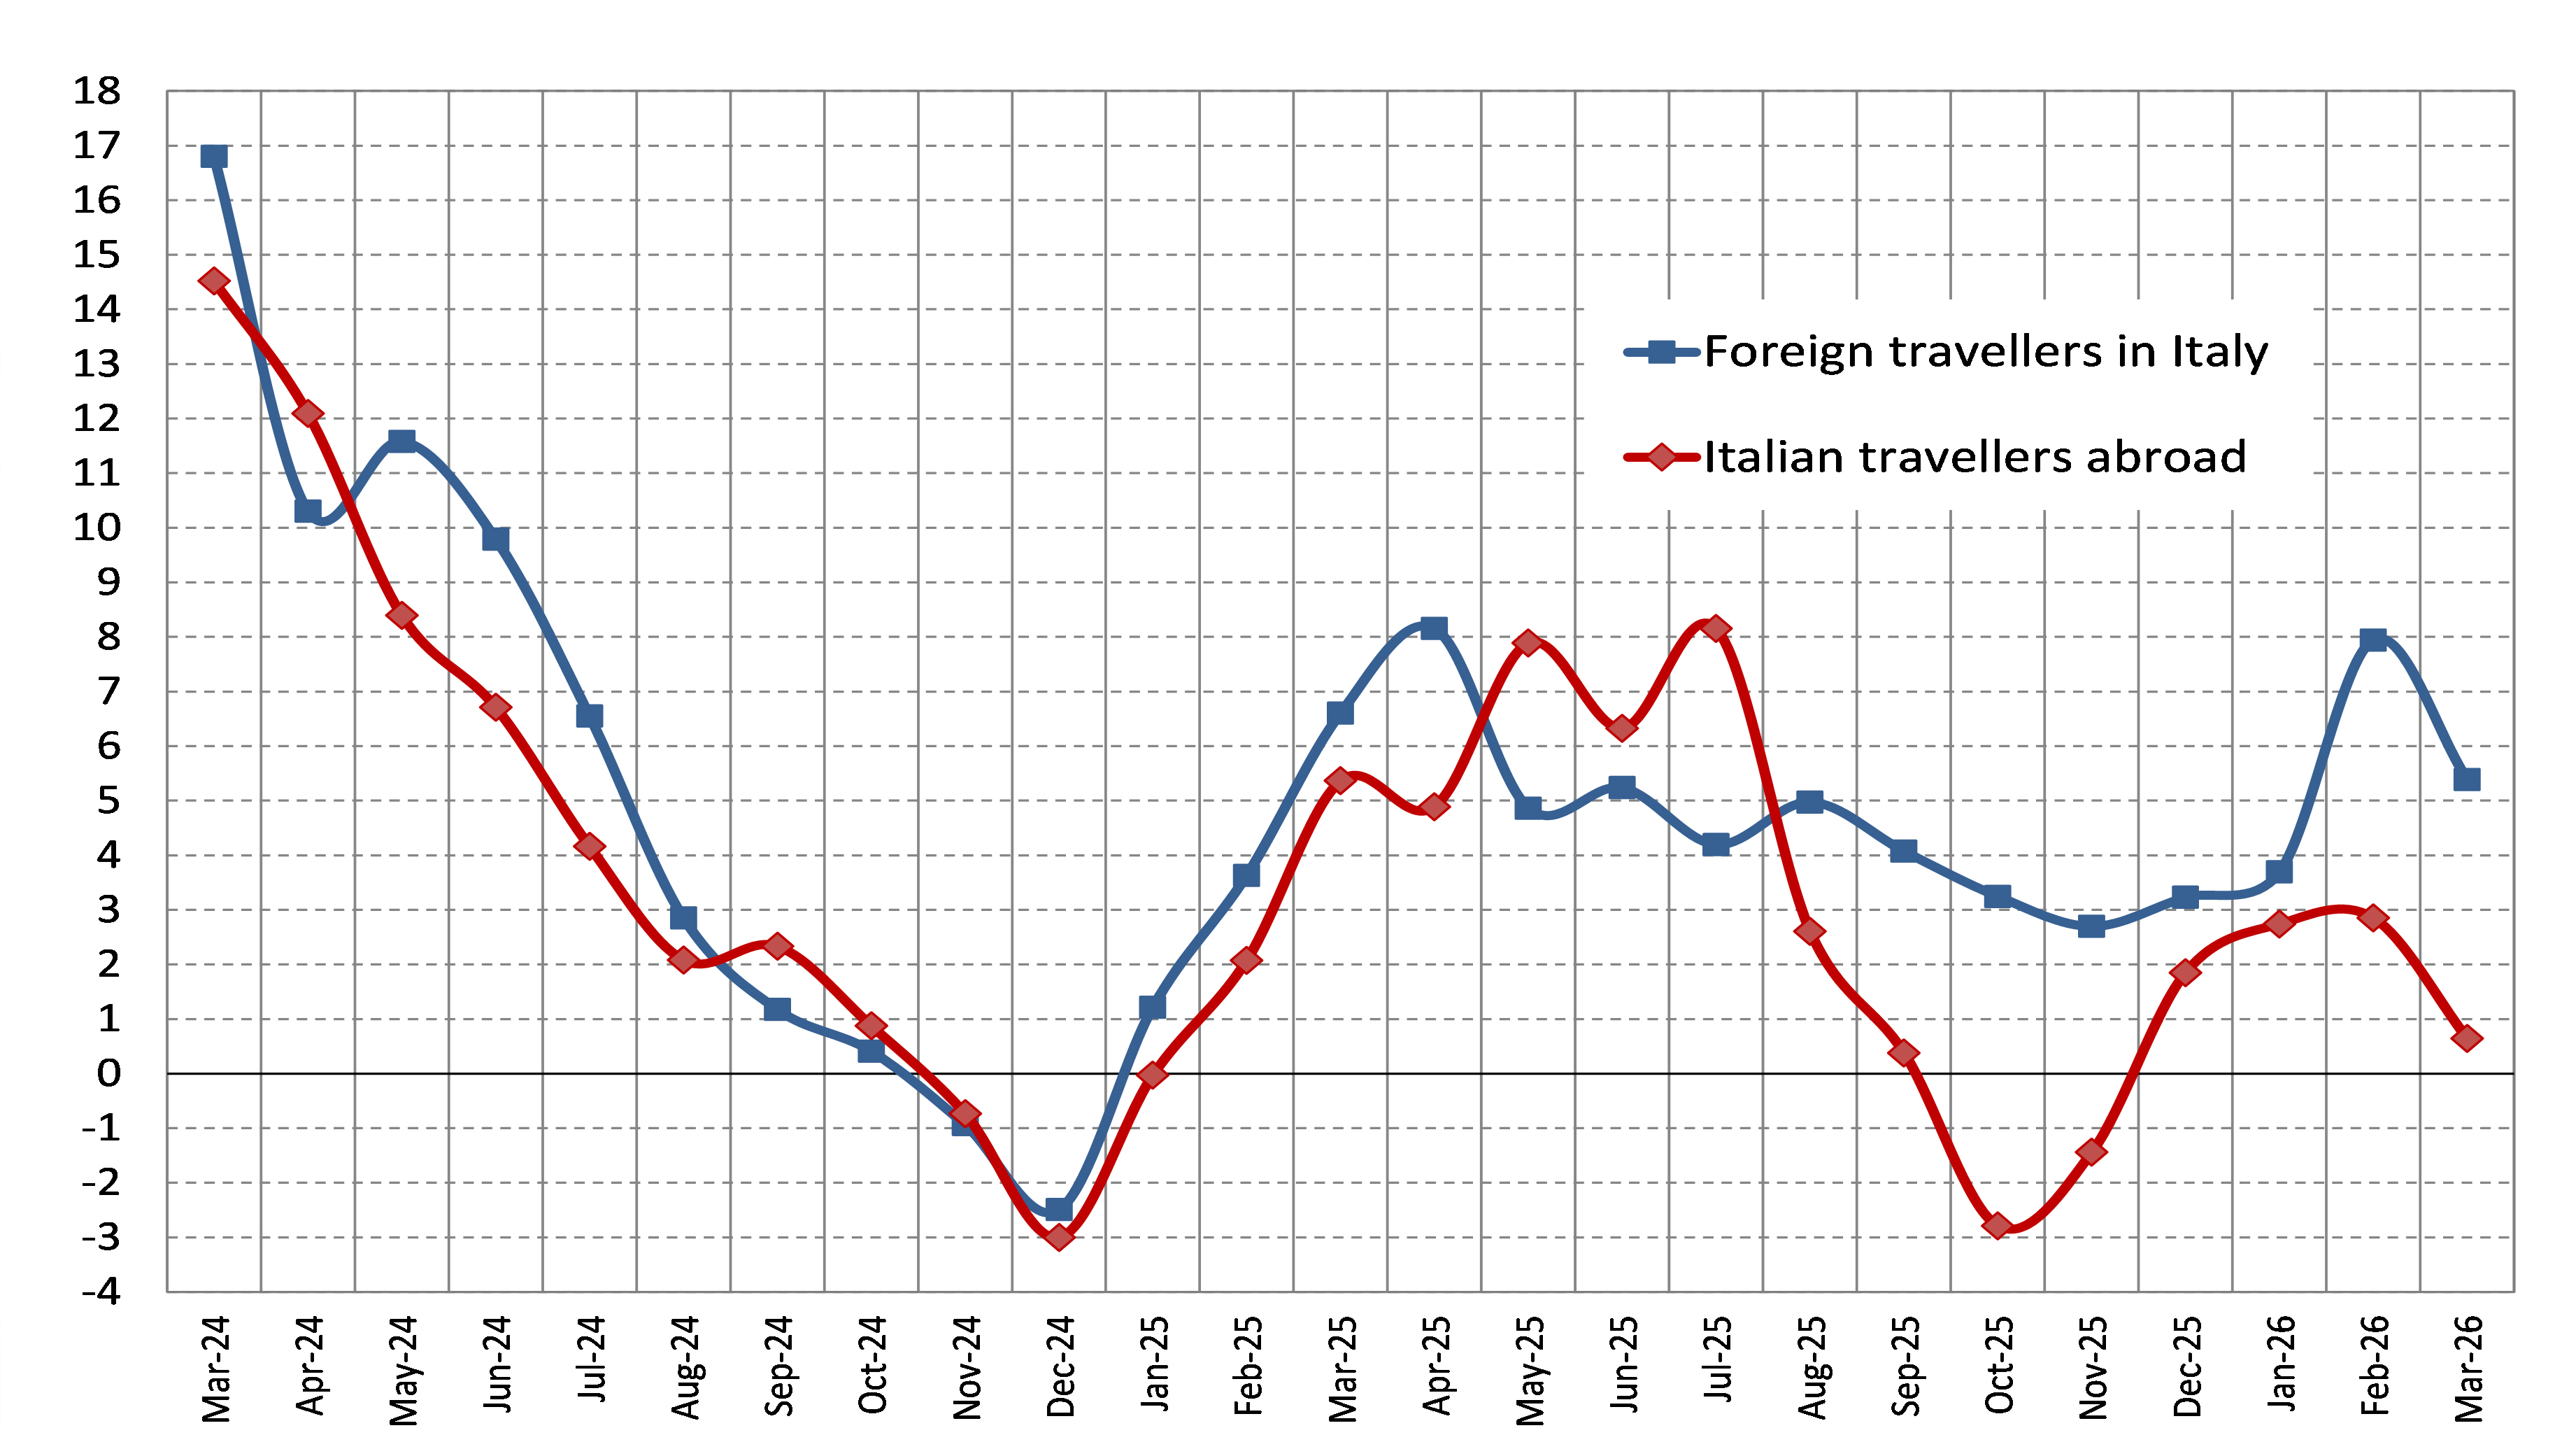
Fig. 2 - Italy's inbound and outbound tourism expenditure by geographical area
(3-month moving averages; year-on-year percentage changes)
 Instagram