Sovereign debt markets: post-pandemic developments and challenges
1. Introduction
Good afternoon and welcome to the 11th International Conference on Sovereign Bond Markets, a joint endeavor among central banks (Bank of Italy, Deutsche Bundesbank, Bank of Canada and the European Central Bank) and U.S. and European academic institutions.
Venice is a historically important venue for sovereign debt: the Republic of Venice was the first state to develop a sovereign debt market, in the late XIII century.1 Historical records show that most of the features of modern sovereign debt were designed here. At that time, just across the eponymous bridge, the island of Rialto was the commercial and financial heart of the city, where merchants met to exchange information about world developments and to conclude contracts. Venice's revenue largely came from indirect taxes, such as salt and customs duties. As military expenses grew, particularly for campaigns in the Italian mainland and naval conflicts to secure the Adriatic, the Republic resorted to a new financing source, namely compulsory financial investments by wealthy citizens.
To this end, the Venetians developed a financial instrument, "prestiti" (i.e. loans), which gave the (forced) purchaser a claim on the state and a right to interest. Such loans were a mere entry in the ledgers of the state loan office ("Camera degli Imprestiti"), so Venice invented not just sovereign bonds, but also dematerialization.
These claims were marketable, with a vibrant secondary market.2 They could even be lent and pledged as collateral for bank loans. Their coupons, called "paghe", also became separately marketable, a detail that parallels modern-day bond "stripping". According to some records, the yield on these credits was also used to set the interest rate on private loans.3
Today, sovereign debt markets continue to be the backbone of complex and sophisticated financial markets. They are key for the transmission of monetary policy and central to financial stability, as they serve as a benchmark for pricing other bonds, as well as loans to firms and households. Sovereign bonds are widely used by financial institutions to meet regulatory requirements and are treated favorably in capital and liquidity frameworks. Critically, they are viewed as 'safe assets' - especially those of advanced economies - due to low credit risk and their tendency to hold or gain value during downturns. This makes them ideal as collateral.
The resilience and smooth functioning of sovereign debt markets is critical for policymakers and authorities. Effective fiscal and monetary policies as well as financial stability hinge on them.
Following the extraordinary shocks to the global economy in recent years, sovereign bond markets are adjusting to new trends, which come with important challenges to policymakers, investors and debt managers. In the rest of my talk I will sketch four recent developments and frame some key challenges and questions for our consideration.
2. Sovereign debt markets: post-pandemic developments
The pandemic left an important debt legacy. Since then, four developments have been shaping sovereign debt markets.
First, public debt increased considerably during the pandemic and is still rising in most countries. According to the IMF, global gross public debt is now about 90 percent of GDP, up from 84 per cent in 2019, and it is projected to reach nearly 100 percent by 2030.4 What stands out most is the expected sharp rise in public debt of the world's two largest economies - China and the United States (Figures 1 and 2). In the euro area, the debt-to-GDP ratio is projected to rise only modestly through 2030. This reflects, in part, the newly reformed EU fiscal rules, designed to promote medium-term debt consolidation while preserving space for public investment and structural reforms. Still, the fiscal outlook remains uncertain, due to geopolitical developments and rising demands for investments and defense-related spending.
The growth of the United States public debt has raised serious concerns about its long-term sustainability.5 And given the central role of the United States in the global economy and for global finance, tensions in its sovereign debt market could have far-reaching consequences, including for emerging economies with significant public and private foreign currency exposures.6
A second key fact is that around half of low-income countries are close to or facing debt distress, according to the IMF and the World Bank.7 The external debt of these economies at the end of 2024 stood at almost 1 trillion of US dollars, up by a third since the onset of the pandemic. While these economies represent only a small share of global GDP, just 2 percent in 2024, their population accounts for around 20 percent of the world's total. A debt crisis in these regions might not shake the global financial system, but it could have serious human and geopolitical consequences, including the risk of heightened conflict and rising migration pressures.
A third key development is that in most countries interest rates have gone back up to "normal" levels, and are not expected to return any time soon to the low levels of the last decade. In advanced economies, nominal and real rates have declined somewhat following the high inflation period, but are still much higher than before the pandemic. The combination of higher debt and higher rates going forward (Figure 3) is expected to increase the cost of servicing the debt (Figure 4).
A fourth key trend is that, following the ultra-accommodative policies that defined the previous decade, since 2022 a growing number of central banks in advanced economies have been reducing the size of their government bonds portfolios, via the so-called quantitative tightening (QT).8
Recent cross-country evidence shows that the increased net supply of government paper caused by QT has been absorbed mostly by nonbanks, both foreign and domestic, though with heterogeneity across countries.9 The process has been smooth so far. In the euro area mainly investment funds and foreign private investors increased their shares, and to a lower extent households, banks, pension funds and insurance companies (Fig. 5.a). In this case as well, cross-country heterogeneity is high. For example, in Italy the households' share increased significantly, whereas banks' share declined.
3. Sovereign debt markets: challenges
These developments - rising sovereign debt, higher interest rates, and a changing investor landscape - raise challenges for researchers, investors and debt management officers (DMOs).
A key question is: at what interest rates will investors be willing to hold such increasing amounts of government debt? In other terms, what is the reactivity of demand for sovereign debt to interest rates?
Our keynote speaker, Professor Greenwood, has conducted seminal work in this field. His research illustrates how different investor types, each with their own preferences for specific segments of the sovereign market, interact with bond arbitrageurs to shape the yield response when quantities change.10
There are multiple dimensions to be taken into account to answer the above question. The reactivity of demand can differ over time, and across investor types, bond maturities, macro-financial conditions, and jurisdictions. There seems to be some consensus that some investors have low elasticity of demand, as they tend to buy and hold the securities. Insurance companies and pension funds are often considered to be part of this category.11 Other investors, instead, such as hedge funds, tend to have high elasticities, especially during stress periods.12 Also, there is some evidence that in periods of stress banks tend to act as contrarian, buying sovereign paper as interest rates rise, whereas foreign investors reduce their exposures.13
Fresh evidence and insights come from new studies such as those that will be presented tomorrow, that examine this topic in the light of granular data and innovative methodologies.14
Overall, this evidence suggests that for debt managers it is important to know the composition of their investor base, and to study the characteristics of demand. For instance, in the euro area the share of sovereign paper held by price sensitive investors has been gradually increasing in recent years (Figure 5.b), and so has the share of hedge funds in trading activity.15 This suggests that in a situation of market stress, other things equal, tensions on sovereign yields might be stronger than in the past.
This risk is exacerbated by the relative scarcity of safe assets in the euro area. A feature which is also relevant to the international role of the euro.
Several commentators have suggested that the current geopolitical conjuncture offers an opportunity for the euro.16 To seize this opportunity, decisive steps are needed toward integrating the EU capital markets more deeply and creating a large, liquid, and unified market for euro-denominated debt securities (a goal worthy in itself, given its relevance for the growth potential of the European economy). The EU Commission has recently put this issue at the centre of its program with the so-called Competiveness Compass, but the absence of a European safe asset remains a critical obstacle.17
The issuance of EU bonds is an important first step. These instruments already enjoy the highest credit rating, and have made real progress since their inception. First, EU bonds are now issued under a unified funding strategy - moving away from fragmented labels like NextGenerationEU, SAFE, and SURE - to present a clear, coherent identity to investors. Second, since October 2024, these bonds are supported by a repo facility run by the European Commission, which helps ensure a smoother functioning of the secondary markets. And third, liquidity has been further enhanced with the introduction of futures contracts, making these instruments more attractive for hedging purposes.18 These improvements have contributed to narrowing the spreads relative to the Bund down to about 40 basis points on average in 2025, from about 70 in 2022 (Figure 6).19
However, if Europe wants to build a financial system that matches the weight of its economy, and offer global investors a credible alternative to the US dollar, it needs to go beyond technical adjustments, and dramatically scale up the issuance of EU bonds, as their total volume remains too modest to support a thriving market and bring down the liquidity premium (Figures 7, 8, 9). Achieving this goal would demand a bold political step to start a process that transcends the current boundaries of existing programs and reflects a shared European vision for the future of our economic and financial union.20 The experience of NextGenerationEU and the other programs mentioned above, however, provides examples of how such a process could be set in motion, as it shows that it is possible to finance an ambitious European investment plan through the issuance of common public debt without having to create a fiscal union or introduce an EU finance ministry.21
Let me thank all participants, speakers and panelists for their contribution, as well as the organizing committee for their efforts for the success of this event. I wish you all a productive and stimulating conference.
FIGURES
Figure 1
Global public debt
(% of GDP)
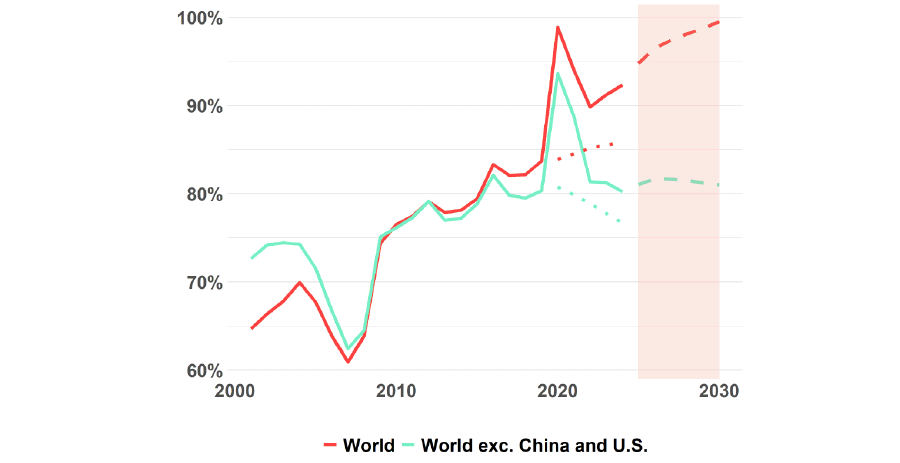
Source: IMF World economic outlook, April 2025 and October 2019.
Note: Dashed (dotted) lines are April 2024 (October 2019) projections. Shaded areas for the 2025-2030 forecast period.
Figure 2
Main regions: public debt-to-GDP ratios
(% of GDP)
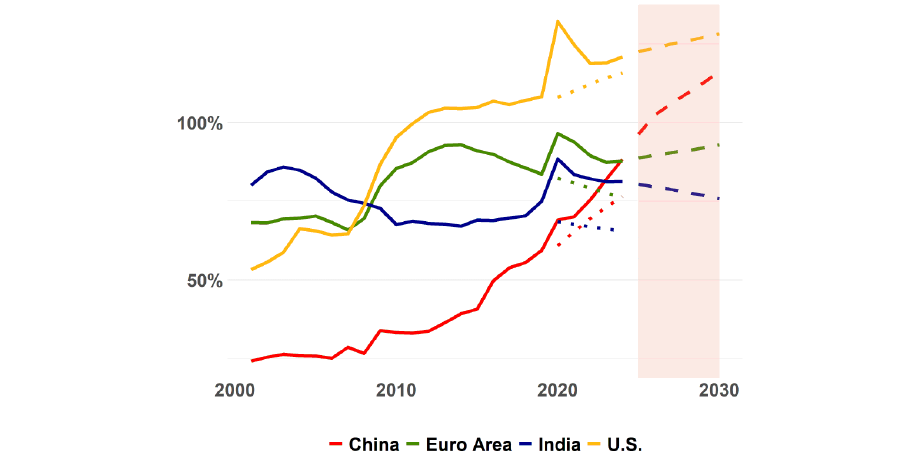
Source: IMF World economic outlook, April 2025 and October 2019.
Note: Dashed (dotted) lines are April 2024 (October 2019) projections. Shaded areas for the 2025-2030 forecast period.
Figure 3
Expected 10-year government bond rates 5 years ahead
(per cent)
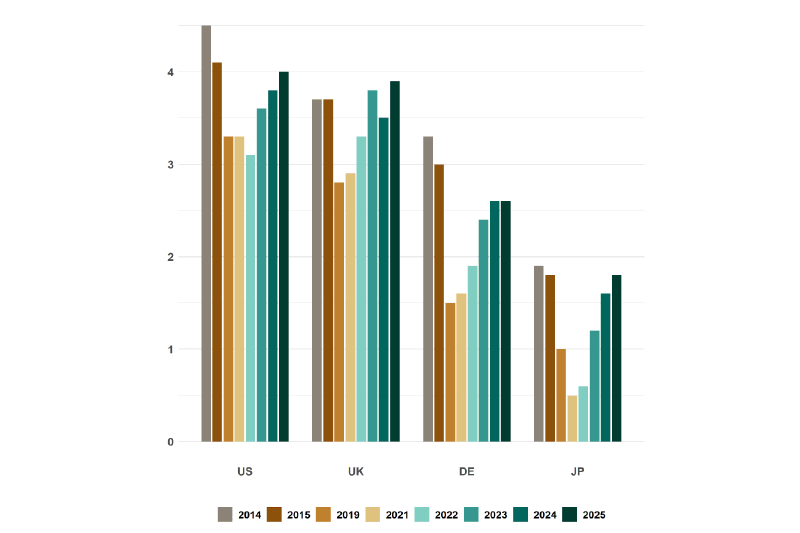
Source: Consensus Forecasts.
Legend: 2025 = April 2025 expectations for 2031-35; 2015 = expectations for 2021-25.
Figure 4
General government interest expenses
(% of GDP)
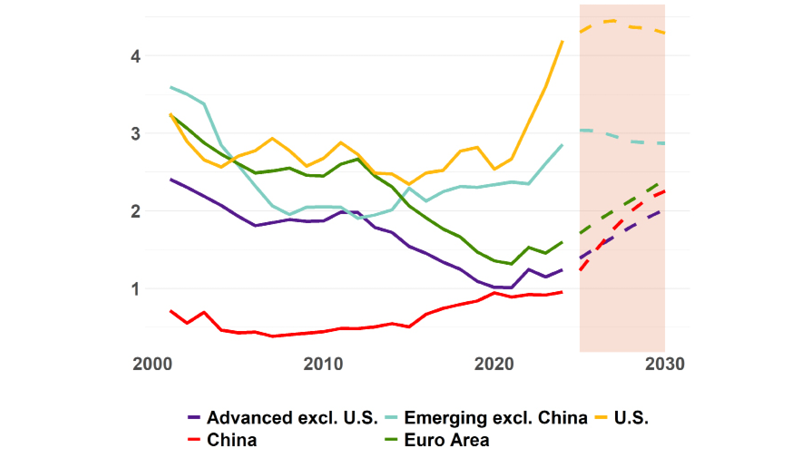
Source: IMF WEO Apr. 2025.
Figure 5a
Sectoral euro area government bond absorption since the end of QE
(change in bond holdings by sector between 2022:Q2 and 2025:Q1 as a fraction of bond outstanding as of 2022:Q2)
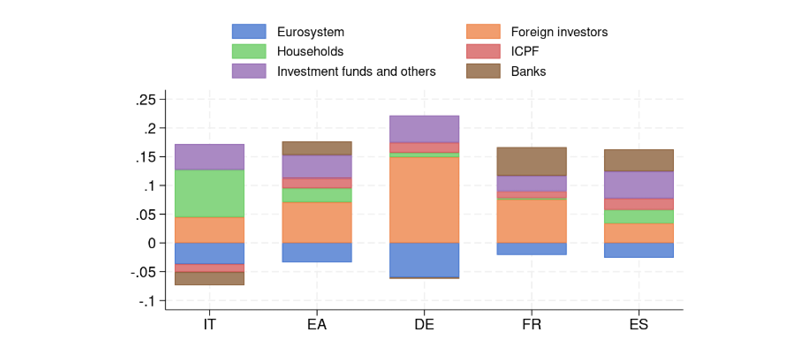
Source: Securities Holdings Statistics, European System of Central Banks.
Figure 5b
Holdings of euro area government bonds
(EUR billions, quarterly data, 2014:1 - 2025:1)
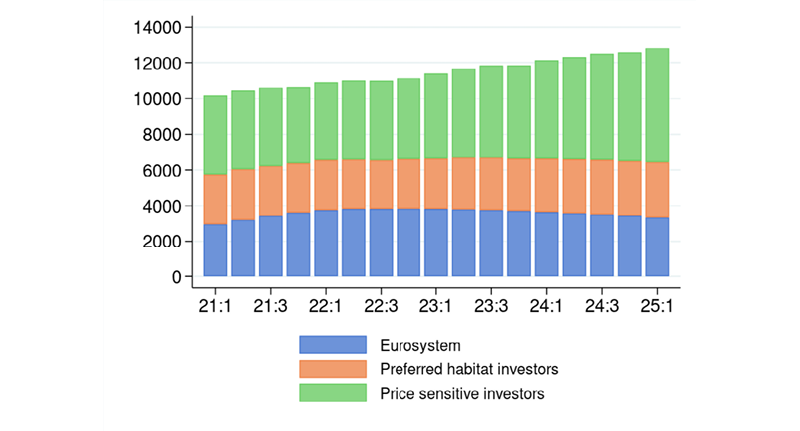
Source: Securities Holdings Statistics, European System of Central Banks.
Notes: Preferred habitat investors include insurance companies and pension funds and foreign official investors and Eurosystem (which is reported separately). Price sensitive investors include the foreign private sector and all other euro area sectors (banks, investment funds, households, non-financial corporations and the public sector). The distinction between the two groups follows Vayanos and Vila (2009, 2021) and Eser et al. (2023). The patterns displayed in the figure do not change if households and firms are considered as preferred habitat investors.
Figure 6
Spread of 10-year EU bond with respect to the 10-year German Bund
(monthly data, basis points)
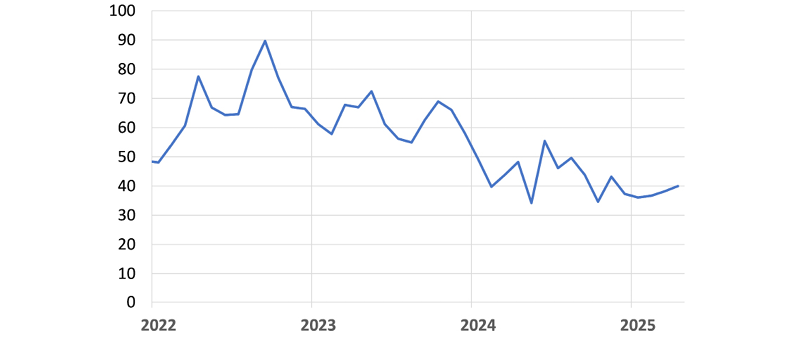
Figure 7
Outstanding global sovereign bonds for the main advanced economies
(box size based on amounts outstanding on December 2024)
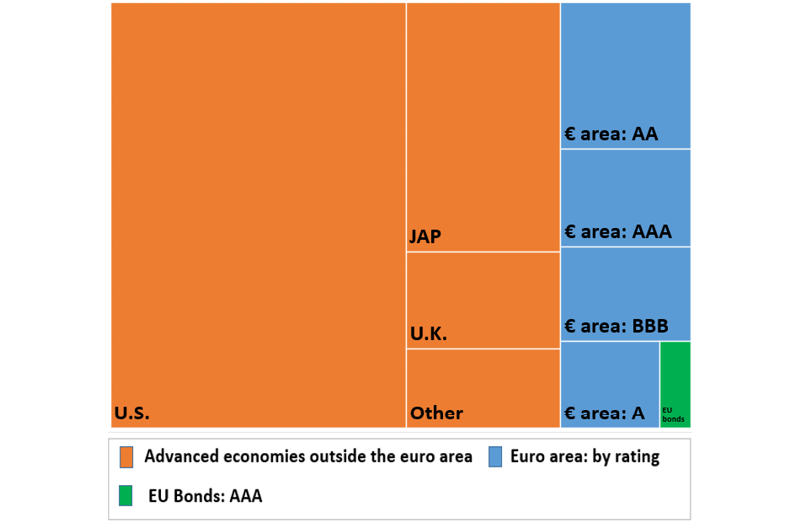
Source: Bloomberg for non-euro area countries. CSDB-Derived Securities Issues Statistics (CSEC) statistics for the euro area outstanding amounts; Centralised Securities Database (CSDB) for EU bonds.
Note: Ratings follow the S&P notation. Euro area sovereign ratings have been grouped in the four categories in the legend. Average of the sovereign rating by the three main agencies as of May 7, 2025. Sovereign bonds of Euro area countries are in blue, by rating.
Figure 8
Sovereign debt securities outstanding in some euro area countries and EU bonds
(EUR billions; monthly data)
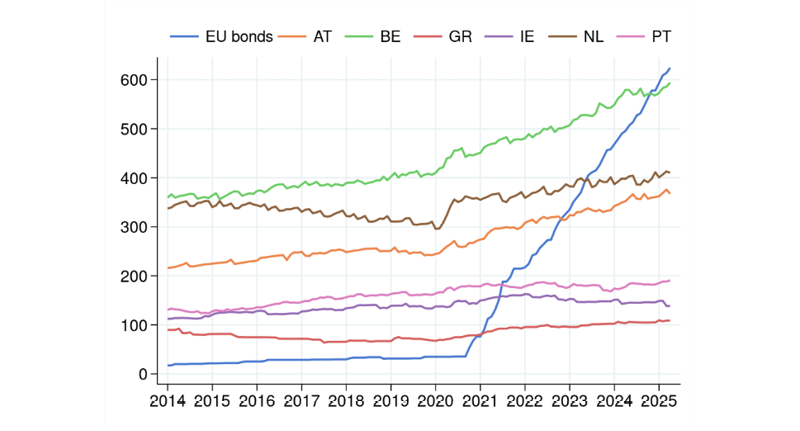
Source: CSEC statistics for individual countries, CSDB for EU-bonds. Last observation: April 2025.
Figure 9
Sovereign debt securities outstanding and liquidity in the euro area
(EUR billions and basis points)
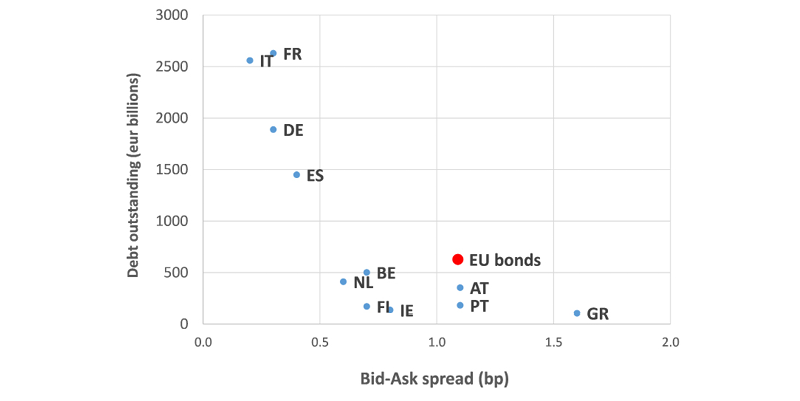
(1) Liquidity is measured with the average bid-ask spread on 10-year government bonds in 2025.
Endnotes
- 1 See for example R.C. Mueller, The Venetian Money Market: Banks, Panics, and the Public Debt,1200-1500, Baltimore, Johns Hopkins University Press, 2019; C.M. Cipolla, Money, Prices, and Civilization in the Mediterranean World: Fifth to Seventeenth Century, Princeton, Princeton University Press, 1956.
- 2 A time series of interest rates on "prestiti" appeared in the first edition of S. Homer, A History of Interest Rates, New Brunswick, Rutgers, 1963.
- 3 Interestingly, Venetian loans attracted wealthy foreign investors. Yet, if these investors became enemies of the Republic, their assets could be frozen, seized, or used as leverage in negotiations-a tactic that echoes modern financial strategies in conflict.
- 4 For context, global debt stood at just 62 percent before the Global Financial Crisis. According to the latest IMF projections, in over one-third of countries, while remaining well above pre-pandemic levels, public debt is expected to rise even further this year. Together, these economies account for three-quarters of global GDP.
- 5 See K. Dynan and D. Elmendorf, 'Putting US Fiscal Policy on a Sustainable Path', NBER Working Paper Series, 33751, 2025; G.J. Hall and T.J. Sargent, 'Fiscal Consequences of the US War on COVID', mimeo.
- 6 S. Arslanalp and B. Eichengreen, 'Living with High Public Debt', Jackson Hole Economic Policy Symposium, 2023.
- 7 See IMF, Debt Sustainability Analysis and World Bank, International Debt Report, 2024.
- 8 The Bank of England led the way, launching quantitative tightening in February 2022. It was soon followed by other major central banks, including the U.S. Federal Reserve and the European Central Bank. At the end of 2024, these central banks had reduced their balance sheet size to 30, 42 and 23 percent of GDP (from their respective peaks of 49, 67 and 35 percent).
- 9 See W. Du, K. Forbes and M.N. Luzzetti, 'Quantitative Tightening Around the Globe: What Have We Learned?', NBER Working Paper Series, 32321, 2024.
- 10 R. Greenwood and D. Vayanos, 'Price Pressures in the Government Bond Market', American Economic Review, 100, 2, 2010, pp. 585-590; R. Greenwood, S. Hanson and D. Vayanos, 'Supply and Demand and the Term Structure of Interest Rates', Annual Review of Financial Economics, 16, 2024, pp. 115-151.
- 11 For evidence on how insurance companies and pension funds' government bond portfolios respond to their liabilities structure and regulation, see D., Domanski, H.S., Shin, and V. Sushko, 'The Hunt for Duration: Not Waving but Drowning?', 2017, IMF Economic Review, 65, and K. Jansen, 'Long-Term Investors, Demand Shifts, and Yields', The Review of Financial Studies, Volume 38, Issue 1, January 2025.
- 12 O. Panzarino, 'Investor Behavior Under Market Stress: Evidence from the Italian Sovereign Bond Market'. Bank of Italy, Markets, Infrastructures, Payment Systems, Research Paper No. 33, 2023; F.M. Ferrara, et al., 'Hedge funds: good or bad for market functioning?'ECB Blog, September 2024. FSB, Report on 'Liquidity in Core Government Bond Markets', 2022.
- 13 P., Angelini, G. Grande, and F. Panetta, 'The negative feedback loop between banks and sovereigns', Bank of Italy, Occasional Papers no. 213, 2014, show that in the aftermath of the sovereign debt crisis Italian banks bought domestic sovereign paper, and that returns turned out to be higher than those from bank loans, on a risk-adjusted basis. By contrast, foreign investors fled the market. Results supporting a similar interpretation are reported in Panzarino, op. cit.
- 14 See, in particular, the conference papers on the U.S. Treasury market by M. Chaudhary, Z. Fu and H. Zhou (2025) 'Anatomy of the Treasury Market: Who Moves Yields?' and by K. Jansen, W. Li and L. Schmid (2025), 'Granular Treasury Demand with Arbitrageurs'.
- 15 F.M. Ferrara et al., op. cit.
- 16 See e.g. H. Rey, Opinion: How Trump's policies could dethrone 'king dollar' and make the euro great again, Marketwatch, May 21, 2025.
- 17 See P. Angelini, Innovation and innovation financing in Europe, 10 March 2025.
- 18 A futures contract was launched by the Intercontinental Exchange in October 2024; another one will be launched in September 2025 on the Eurex. This will enhance the ecosystem across cash, repo, and derivatives markets in line with international fixed income standards.
- 19 K. Pallara, M. Pericoli and P. Tommasino, "Issuing European safe assets: how to get the most out of Eurobonds?", Banca d'Italia, Questioni di Economia e Finanza, forthcoming.
- 20 See O. Blanchard and A. Ubide, "Now is the time for Eurobonds: A specific proposal", Realtime economics blog, Peterson Institute for International Economics, May 30, 2025. The scheme closely resembles the proposal advanced by Cioffi et al., Outline of a redistribution-free debt redemption fund for the euro area, Bank of Italy, Occasional Papers no. 479, 2019.
- 21 F. Panetta, The Governor's concluding remarks, May 2025.
 Instagram