Squilibri globali e i loro rischi in un'economia mondiale più frammentata
Se si giudicasse lo stato dell'economia mondiale esclusivamente dai risultati del 2025, non si ravviserebbero particolari problemi. Gli sconvolgimenti geopolitici e le tensioni commerciali tra paesi sembrerebbero aver inciso solo marginalmente.
Secondo le più recenti stime del Fondo Monetario Internazionale (FMI), la crescita globale si è mantenuta al di sopra del 3 per cento lo scorso anno e rimarrà su livelli analoghi anche nel 2026. Il commercio mondiale ha mostrato una notevole tenuta nonostante l'introduzione dei dazi statunitensi. L'inflazione ha continuato a ridursi, avvicinandosi agli obiettivi delle banche centrali. I mercati finanziari, pur con episodi di volatilità, hanno registrato ottimi risultati, con rialzi azionari a doppia cifra nelle principali piazze.
Vi sono indubbiamente aspetti positivi, alcuni dei quali destinati a durare. La rivoluzione dell'intelligenza artificiale sostiene gli investimenti e il commercio internazionale: circa metà dell'aumento degli scambi globali dello scorso anno ha riguardato prodotti legati a questa tecnologia, che promette di dare un forte impulso alla produttività. Le imprese hanno dimostrato capacità di adattamento, riorientando gli scambi con rapidità e attenuando l'impatto dei dazi. L'allentamento monetario, favorito dal rientro dell'inflazione, agevola il finanziamento dell'economia.
Tuttavia, sotto la superficie di questi risultati favorevoli si stanno accumulando squilibri che potrebbero rivelarsi destabilizzanti, se non affrontati per tempo. Non si tratta di fenomeni nuovi, ma di problemi che hanno afflitto molte economie in passato. In questo intervento, mi concentrerò su alcuni aspetti particolarmente rilevanti per la politica monetaria e per la stabilità finanziaria: la crescita del debito pubblico globale, gli squilibri commerciali tra paesi e le vulnerabilità in specifici segmenti dei mercati finanziari, che possono amplificare i rischi.
1. La crescita del debito pubblico nelle principali economie
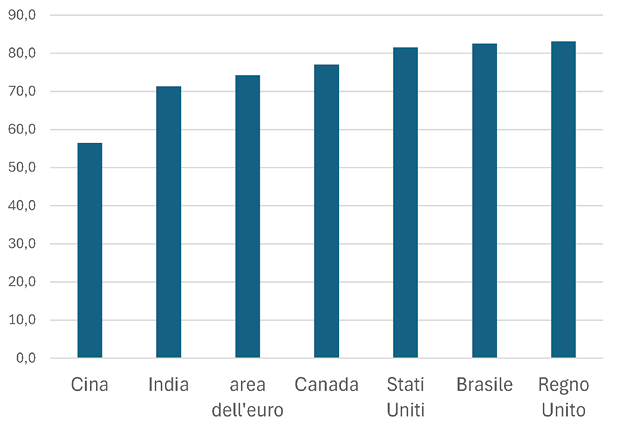
Il debito pubblico nelle principali economie ha raggiunto livelli storicamente elevati. È pari a circa il 230 per cento del PIL in Giappone, a oltre il 120 negli Stati Uniti, a circa il 100 in Cina e nel Regno Unito e a poco meno del 90 nell'area dell'euro. L'incremento negli ultimi due decenni è stato impressionante: circa 60 punti percentuali in Giappone, Stati Uniti e Regno Unito, poco meno in Cina e oltre 20 punti nell'area dell'euro (fig. 1); circa 30 punti in Italia, dove già il livello era elevato.
A questi andamenti hanno contribuito i grandi shock degli ultimi anni, dalla crisi finanziaria globale alla pandemia, fino alla crisi energica. Essi riflettono sia l'operare degli stabilizzatori automatici sia ampi interventi discrezionali, solo in parte riassorbiti.
Non vi sono segnali di un rientro del debito nel medio termine. Al contrario, secondo l'FMI entro il 2030 il debito pubblico globale supererà il 100 per cento del PIL, il valore più alto dal 19481. Crescerebbe di quasi 20 punti negli Stati Uniti e in Cina2; nell'area dell'euro l'aumento previsto è minore (meno di 5 punti percentuali), ma resta elevata l'incertezza, anche per gli impegni di spesa per la difesa non ancora pienamente incorporati nelle stime.
Le prospettive di finanza pubblica sono aggravate dalle pressioni derivanti dall'invecchiamento della popolazione sui sistemi pensionistici e sanitari, oltre che da un differenziale tra costo del debito e crescita molto meno favorevole rispetto al recente passato. Inoltre, in società più polarizzate, sia sul piano economico sia su quello politico, è più complesso ottenere consenso per misure di consolidamento.
Le implicazioni per i mercati e per la stabilità monetaria e finanziaria
Una politica di bilancio espansiva può essere necessaria soprattutto in presenza di shock rilevanti. Gli interventi durante la pandemia e la crisi energetica hanno evitato recessioni prolungate e fallimenti a catena, trasferendo i rischi al settore pubblico. Se però un'espansione continuata mette in dubbio la sostenibilità del debito pubblico, emergono inevitabilmente criticità per i mercati, per la politica monetaria e, nei casi estremi, per la stabilità finanziaria.
Finora, l'impatto sui mercati è stato relativamente contenuto, manifestandosi soprattutto in un irrigidimento della curva dei rendimenti, in parte legato all' aumento del premio per il rischio3 (fig. 2). Ciò incentiva un accorciamento delle scadenze dei titoli all'emissione: una scelta che riduce i costi nel breve periodo ma aumenta la volatilità del servizio del debito nel tempo, complicandone la gestione.
Una crisi dei debiti sovrani resta un evento a bassa probabilità nei paesi avanzati, che dispongono di ampie risorse per evitarla. In assenza di correzioni, tuttavia, i rischi potrebbero intensificarsi: minori margini di intervento per affrontare nuove crisi, maggiore incertezza per famiglie e imprese, tensioni finanziarie con possibili effetti di contagio anche verso paesi con fondamentali solidi.
Le implicazioni riguardano anche la politica monetaria. L'esperienza storica e la letteratura economica indicano due questioni centrali. Con livelli elevati di debito pubblico si rafforza l'interdipendenza tra politica fiscale e politica monetaria; una stretta necessaria per contenere l'inflazione può accentuare gli squilibri fiscali, causando, nei casi più gravi, tensioni istituzionali fino a mettere a rischio l'autonomia decisionale delle banche centrali.
Inoltre, il controllo dell'inflazione è pienamente efficace solo se la politica di bilancio è sostenibile; in caso contrario, le vie d'uscita finiscono per essere inevitabilmente inflazione elevata, repressione finanziaria, o una combinazione delle due4.
L'Europa gode di un elevato grado di protezione rispetto a questi rischi: ha adottato regole che limitano la discrezionalità dei governi a espandere il debito e un assetto istituzionale che tutela l'indipendenza delle banche centrali. Tuttavia, essa vive un apparente "paradosso": il suo debito pubblico è, allo stesso tempo, troppo alto e troppo basso. Esso va certamente ridotto in alcuni Stati membri: da questo punto di vista, è cruciale che l'Italia prosegua il suo percorso di aggiustamento e sono incoraggianti i risultati raggiunti in termini di riduzione del differenziale di rendimento dei suoi titoli sovrani rispetto a quelli dei principali partner europei.
Al contempo, un maggiore ricorso a forme di debito comune europeo sarebbe importante per finanziare progetti strategici e migliorare l'efficienza complessiva della spesa in settori chiave, dalla ricerca, all'energia, alla difesa; garantirebbe inoltre che un titolo sicuro (safe asset) europeo venga emesso in quantità adeguata, facilitando la politica monetaria comune e promuovendo l'unione dei mercati dei capitali e il ruolo internazionale dell'euro5.
2. Gli squilibri commerciali
La persistente presenza di avanzi e disavanzi eccessivi di conto corrente è un secondo rilevante fattore di rischio per l'economia globale.
Dopo una fase prolungata di graduale riduzione, gli squilibri hanno ripreso ad ampliarsi: nel 2024, il valore aggregato dei saldi, in termini assoluti, è salito al 3,6 per cento del PIL mondiale, dal 3,0 per cento del 2023, accentuando il già marcato sbilanciamento delle posizioni nette sull'estero tra paesi creditori e paesi debitori.
Gli squilibri sono concentrati in poche grandi economie. Gli Stati Uniti rappresentano circa i tre quarti del disavanzo globale, mentre Cina e area dell'euro contribuiscono complessivamente a circa la metà dell'avanzo mondiale. La persistenza dei flussi si riflette negli stock: negli Stati Uniti si concentra circa il 75 per cento della posizione debitoria netta globale.
Saldi in surplus o in deficit possono riflettere fattori ciclici o strutturali - come demografia o le prospettive di crescita rispetto alle altre economie - senza segnalare necessariamente criticità. Tuttavia, secondo il FMI, nel 2024 oltre il 40 per cento dei saldi di conto corrente globali risultava "eccessivo", ossia non giustificato dai fondamentali macroeconomici6.
Alla base degli squilibri vi sono prevalentemente fattori domestici.
Negli Stati Uniti, il persistente disavanzo di parte corrente riflette un eccesso di spesa, quindi una carenza di risparmio, trainata in larga misura dal settore pubblico (fig. 3). A ciò si aggiunge il ruolo del dollaro come valuta di riserva globale: l'elevata domanda di attività denominate in dollari contribuisce a mantenere bassi i tassi di interesse, sostenendo gli investimenti e riducendo l'incentivo al risparmio7.
In Cina, l'ampliamento dell'avanzo è legato alla debolezza della domanda interna e a politiche che privilegiano produzione ed esportazioni rispetto ai consumi (figg. 4.1 e 4.2). Vi contribuiscono il controllo sui flussi di capitale, l'elevato risparmio delle famiglie8 - indotto anche da un welfare pubblico limitato - e il ricorso esteso a politiche industriali e aiuti di Stato, la cui portata è difficile valutare per la scarsa trasparenza9.
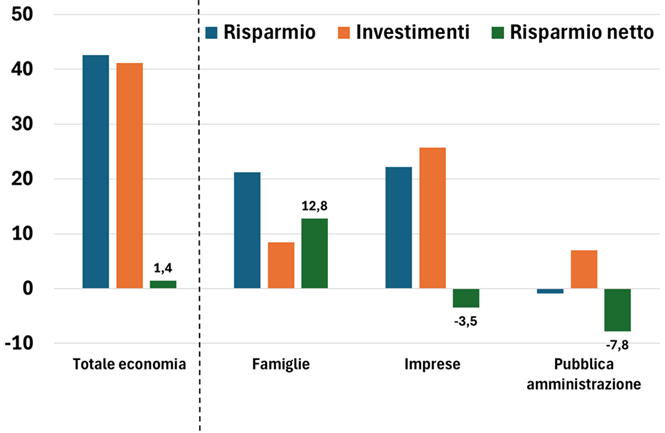
Nell'area dell'euro, il surplus riflette alti livelli di risparmio privato a fronte di deboli investimenti privati. Come per gli Stati Uniti, il settore pubblico è l'unico prenditore netto; diversamente dagli Stati Uniti, tuttavia, l'indebitamento pubblico è più che compensato dai risparmi netti positivi del settore privato (fig. 5). Tra i fattori strutturali, la frammentazione del mercato dei capitali europeo limita l'allocazione efficiente del risparmio verso investimenti produttivi di lungo termine10.
Le prospettive di medio termine
Il riequilibrio globale non può essere dato per scontato. Il FMI prevede una moderata riduzione degli squilibri entro il 2030, ma le proiezioni restano incerte e dipendono in modo cruciale dalle scelte di politica economica nazionali.
Negli Stati Uniti, la riduzione del disavanzo esterno dovrebbe realizzarsi tramite un aumento del risparmio privato, ma le dinamiche fiscali e l'ampia posizione patrimoniale netta negativa rappresentano rischi rilevanti. L'aumento dei dazi nel 2025, oltre i costi che esso comporta, potrebbe avere effetti più limitati del previsto sul conto corrente, nonostante il concomitante deprezzamento del dollaro possa aver favorito la competitività11. Inoltre, la forte crescita delle importazioni di beni legati all'intelligenza artificiale potrebbe proseguire, secondo alcune analisi, almeno per il prossimo triennio12.
In Cina, il riequilibrio resta frenato dalla debolezza della domanda interna e da politiche non ancora sufficientemente orientate ai consumi. Nell'area dell'euro l'aggiustamento richiede soprattutto un rafforzamento degli investimenti privati, che potrebbe essere stimolato da strumenti fiscali comuni.
Implicazioni per la stabilità finanziaria
La persistenza di squilibri di conto corrente ha implicazioni rilevanti per la stabilità finanziaria e per la crescita globale, attraverso almeno quattro canali.
In primo luogo, le vulnerabilità dei paesi in deficit si accentuano quando le condizioni finanziarie globali si inaspriscono: possono verificarsi improvvise interruzioni dei flussi di capitale, carenze di liquidità e rapidi disinvestimenti, con il rischio di crisi valutarie13.
In secondo luogo, disavanzi persistenti comportano un accumulo di passività nette e maggiori deflussi di reddito, alimentando dinamiche di debito avverse, soprattutto in contesti di bassa crescita o tassi di interesse elevati14.
In terzo luogo, gli eccessivi disavanzi di conto corrente sono la controparte di avanzi persistenti in altre economie e dei relativi flussi di capitale. Se l'eccesso di risparmio è concentrato in grandi economie, i tassi di interesse reali globali tendono a comprimersi, favorendo l'assunzione di rischio e la formazione di bolle nei prezzi delle attività15. La successiva correzione può essere brusca e innescare processi di deleveraging e instabilità finanziaria.
Infine, l'esperienza storica mostra che le correzioni improvvise degli squilibri raramente restano circoscritte: le tensioni tendono a propagarsi rapidamente attraverso i canali finanziari e commerciali.
Rispetto al passato, le economie emergenti sono oggi meno esposte a crisi della bilancia dei pagamenti, avendo ridotto il debito in valuta estera e adottato politiche economiche più coerenti16. Nell'attuale configurazione, che vede gli Stati Uniti come principale debitore, i rischi sono stati finora mitigati dalla forte domanda di attività denominate in dollari e dal ruolo centrale dei mercati finanziari statunitensi.
Tuttavia, emergono fragilità crescenti. È aumentata l'incertezza sulle politiche di bilancio e sugli effetti della frammentazione geopolitica sul sistema finanziario. Il deprezzamento del dollaro dopo l'annuncio dei nuovi dazi ad aprile, così come in altri episodi successivi, ha evidenziato la sensibilità dei prezzi degli attivi statunitensi a shock di fiducia, riaccendendo il dibattito sulla sostenibilità del ruolo del dollaro nel sistema monetario internazionale17.
Nel complesso, una riduzione ordinata degli squilibri commerciali richiede un'azione coordinata tra le principali economie. Iniziative unilaterali accrescono costi e incertezza senza garantire soluzioni efficaci e durature.
3. Vulnerabilità nel sistema finanziario
In un contesto segnato da ampi squilibri macroeconomici - elevato debito pubblico, persistenti squilibri di conto corrente, tensioni geopolitiche e conseguente ricomposizione dei flussi di capitale - la presenza di fragilità in alcuni segmenti del sistema finanziario può amplificarne i rischi.
Il ruolo crescente dei fondi speculativi (hedge funds) nei mercati dei titoli sovrani
Negli ultimi tre anni l'indebitamento degli hedge funds è aumentato sensibilmente, così come il loro peso nei mercati dei titoli di Stato.
Per i principali operatori il debito è più che raddoppiato, avvicinandosi ai 7.000 miliardi di dollari (fig. 6), pari a quasi un quarto del PIL statunitense. L'espansione riflette soprattutto un marcato incremento della leva finanziaria (fig. 7). L'indebitamento è concentrato in pochi grandi fondi, con leva spesso superiori a dieci (fig. 8).
Una quota rilevante dei finanziamenti proviene dal mercato dei pronti contro termine, tramite operazioni a brevissima scadenza continuamente rinnovate; la restante parte è fornita da poche grandi banche globali. Ne deriva un sistema concentrato, interconnesso e dipendente da condizioni di liquidità abbondante.
Particolare attenzione è stata rivolta alle strategie di arbitraggio sui titoli di Stato - come basis trade e spread trade - che sfruttano minime discrepanze tra prezzi spot e derivati18. Tali strategie comportano una trasformazione di liquidità e scadenze simile a quella bancaria: acquisto di titoli pubblici a medio-lungo termine, finanziato con passività a breve e copertura del rischio di tasso tramite derivati.
Le coperture riducono l'esposizione alle variazioni di prezzo, ma non eliminano i rischi. In fasi di stress, l'aumento dei margini può generare tensioni di liquidità e vendite forzate. Un deterioramento nel mercato dei pronti contro termine - minore liquidità o tassi meno favorevoli - può compromettere le strategie e innescare dismissioni simultanee. Con leva elevata, queste dinamiche possono amplificare la volatilità nei mercati dei titoli sovrani e trasmettere tensioni alle banche finanziatrici, accentuando il contagio tra giurisdizioni, banche e intermediari non bancari.
Negli Stati Uniti sono state introdotte misure per rafforzare la resilienza del mercato repo e la trasparenza dei fondi19, 20. Tuttavia, in assenza di informazioni granulari e tempestive, la valutazione dei rischi sistemici resta incompleta21. Anche in Europa, nonostante presìdi regolamentari più stringenti22, persistono aree di opacità, accentuate dalla presenza di intermediari non residenti e con attività estese oltre i confini nazionali.
Resta poi una questione di fondo: gli hedge funds hanno assorbito una parte significativa dell'ampia offerta di titoli del Tesoro statunitense in una fase di domanda internazionale più debole, anche per la riallocazione delle riserve verso oro e altre valute. Se questa domanda è sostenuta da posizioni ad alta leva e finanziamenti a breve termine, ne deriva una potenziale vulnerabilità per un mercato cruciale del sistema finanziario globale.
Leva e opacità nei mercati dei capitali privati
Nell'ultimo decennio i mercati dei capitali privati - venture capital, private equity e Private credit - hanno registrato una forte espansione, raggiungendo quasi 16.000 miliardi di dollari di attivi (fig. 9) 23, 24. Pur restando molto inferiori ai mercati quotati, rappresentano una fonte cruciale di finanziamento, soprattutto per imprese innovative; il loro sviluppo, specie in Europa, va sostenuto, pur se entro adeguati presìdi.
Le principali vulnerabilità derivano dalla combinazione di leva, opacità informativa e scarsità di dati. L'ecosistema è costituito da una rete complessa di banche, intermediari non bancari e imprese; recenti episodi di insolvenza negli Stati Uniti hanno mostrato come shock circoscritti in questi mercati possano generare perdite diffuse25.
La leva è presente lungo tutta la catena di intermediazione: le imprese finanziate sono spesso fortemente indebitate e con basso merito creditizio; le operazioni di private equity avvengono tramite leveraged buyout, finanziate prevalentemente da banche o fondi di private credit, con linee di credito ai fondi e talvolta agli stessi investitori, che amplificano l'esposizione complessiva26.
Sebbene le evidenze suggeriscano livelli medi di leva ancora contenuti27, la stima è resa complessa dalla scarsità di dati, soprattutto quando sono coinvolti intermediari non vigilati28. Le oggettive difficoltà di valutazione e l'elevata illiquidità degli attivi possono ritardare l'emersione delle perdite, determinando aggiustamenti bruschi e concentrati nel tempo.
La volatilità delle criptoattività non garantite29
La capitalizzazione delle criptoattività non garantite è di circa 2.000 miliardi di dollari (fig. 10). Il settore resta altamente volatile; nell'ultimo anno il bitcoin - che rappresenta circa il 60 per cento del mercato - ha oscillato tra i 120.000 e i 63.000 dollari (fig. 11).
L'interconnessione con il sistema finanziario tradizionale è aumentata e potrebbe aumentare ulteriormente alla luce di orientamenti più favorevoli negli Stati Uniti30.
La volatilità dipende da due fattori principali: la difficoltà di determinare il valore di queste attività in assenza di flussi di reddito o parametri condivisi e le lacune regolamentari, anche per il limitato coordinamento internazionale.
Negli ultimi mesi, a seguito di notizie di mercato negative, le criptoattività hanno registrato correzioni più marcate e persistenti rispetto ai mercati azionari31; negli ultimi quattro mesi il loro valore complessivo si è dimezzato, risentendo anche delle incertezze normative32.
Un ruolo rilevante è stato svolto dal mercato dei derivati su criptoattività, i cui volumi superano di gran lunga quelli del mercato spot33 e che opera in larga misura su piattaforme residenti in giurisdizioni accomodanti che consentono posizioni a leva estreme e collaterale di bassa qualità34.
Alle correzioni iniziali sono seguite liquidazioni a catena e vendite forzate. Il ritiro di alcuni market maker35 e malfunzionamenti tecnologici36 hanno aggravato la carenza di liquidità.
Nel complesso, l'espansione della leva finanziaria e la scarsa trasparenza in diversi segmenti del sistema finanziario accrescono i rischi connessi ai rilevanti squilibri macroeconomici. Una maggiore cooperazione internazionale in ambito regolamentare e un più intenso scambio di informazioni tra autorità sono essenziali per preservare la stabilità finanziaria globale.
4. Conclusioni
Il conseguimento di una crescita mondiale più equilibrata e meno esposta a rischi di crisi beneficerebbe enormemente di un'azione coordinata tra le principali economie.
Le politiche macroeconomiche necessarie sarebbero, peraltro, pienamente coerenti con l'interesse delle singole economie. Rientrano in questa prospettiva politiche fiscali che assicurino la sostenibilità dei debiti pubblici; un deciso sostegno alla domanda interna nelle economie con persistenti surplus commerciali; la promozione del libero scambio di beni, servizi e capitali, evitando pratiche distorsive della concorrenza; accordi per una maggiore armonizzazione regolamentare per soggetti e strumenti finanziari che operano su scala globale.
Un approccio coordinato appare oggi indubbiamente più difficile, in un contesto di relazioni internazionali conflittuali e di indebolimento delle istituzioni multilaterali.
Se l'impegno per una rinnovata cooperazione internazionale non va abbandonato, l'Unione europea deve prendere atto che il profondo cambiamento della scena mondiale richiede un salto di qualità nelle politiche interne.
La direzione di marcia in molti ambiti è corretta - dai recenti nuovi accordi commerciali con i paesi dell'America Latina e con l'India, alla rinnovata volontà di ampliare e approfondire il mercato unico, di costruire un mercato dei capitali realmente integrato, di semplificare le regole che appesantiscono l'attività economica. Tuttavia, i progressi restano lenti, le iniziative frammentate e le scelte spesso riflettono il minimo comune denominatore degli interessi degli Stati membri, più che una visione strategica nell'interesse europeo.
Occorre un drastico ripensamento del modo di operare, prendere decisioni e agire, recuperando quella unità di intenti che l'Europa ha dimostrato in altre occasioni della sua storia, quando ha saputo trasformare le difficoltà in occasioni di avanzamento e integrazione.
Figure
Figura 1
Rapporto debito/PIL nelle principali economie
(variazioni percentuali rispetto al 4° trim. 2019 e contributi percentuali)
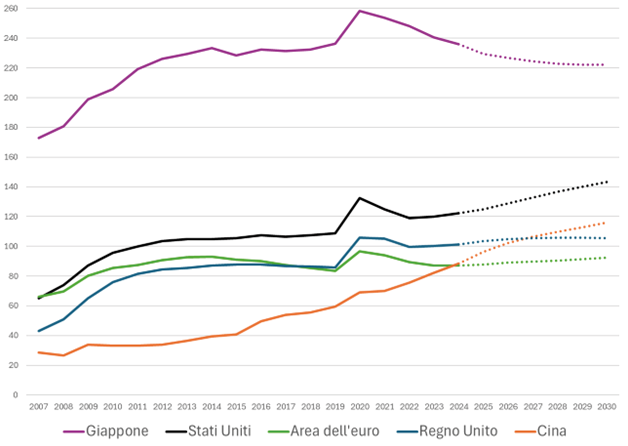
Fonte: Fondo Monetario Internazionale, World Economic Outlook Database
Figura 2
Tassi forward fra 5 e 10 anni
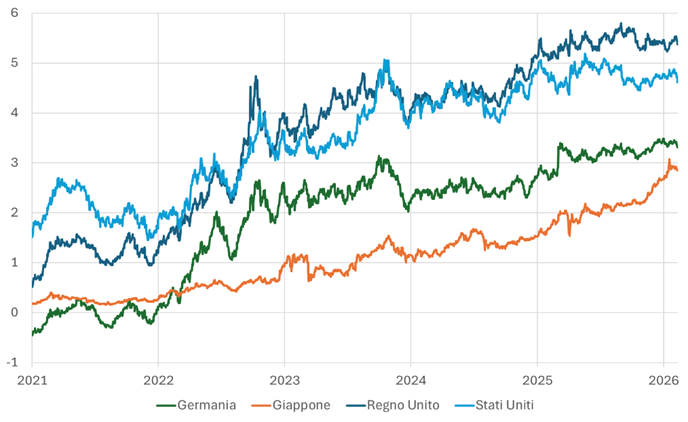
Fonte: LSEG ed elaborazioni Banca d'Italia.
Note: tassi forward fra 5 e 10 anni estratti dalle strutture per scadenza dei tassi zero coupon sui titoli di Stato di Germania, Giappone, Regno Unito e Stati Uniti.
Figura 3
Il risparmio e gli investimenti degli Stati Uniti per settore istituzionale nel 2024
(in percentuale del PIL)
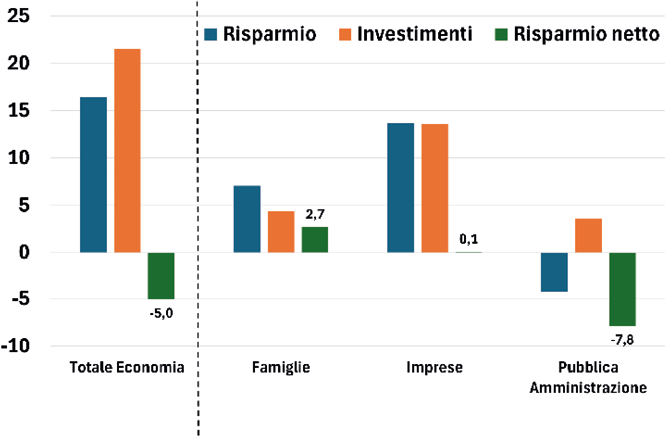
Fonte: Bureau of Economic Analysis.
Note: I numeri si riferiscono al risparmio netto per ciascun settore e per il complesso dell'economia (che a sua volta coincide con il saldo di conto corrente al netto di una discrepanza statistica parti a circa l'1% del PIL per gli USA nel 2024) in percentuale del PIL.
Figura 4.1
Il risparmio e gli investimenti della Cina per settore istituzionale nel 2023
(in percentuale del PIL)
Fonte: dati National Bureau of Statistics of China (NBS).
Note: I numeri si riferiscono al risparmio netto per ciascun settore e per il complesso dell'economia (che a sua volta coincide con il saldo di conto corrente) in percentuale del PIL.
Figura 4.2
Consumi finali delle più grandi economie mondiali nel 2024
(in percentuale del PIL)
Fonte: dati FMI World Economic Outlook October 2024.
Note: I numeri si riferiscono a consumi privati e pubblici in percentuale del PIL.
Figura 5
Il risparmio e gli investimenti dell'area dell'euro per settore istituzionale nel 2024
(in percentuale del PIL)
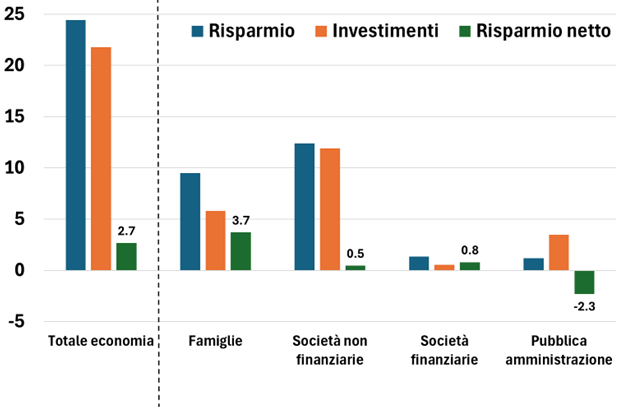
Fonte: dati Eurostat di contabilità nazionale.
Note: I numeri si riferiscono al risparmio netto per ciascun settore e per il complesso dell'economia (che a sua volta coincide con il saldo di conto corrente) in percentuale del PIL.
Figura 6
Debito dei fondi speculativi per strategia di investimento
(migliaia di miliardi di dollari; dati trimestrali)
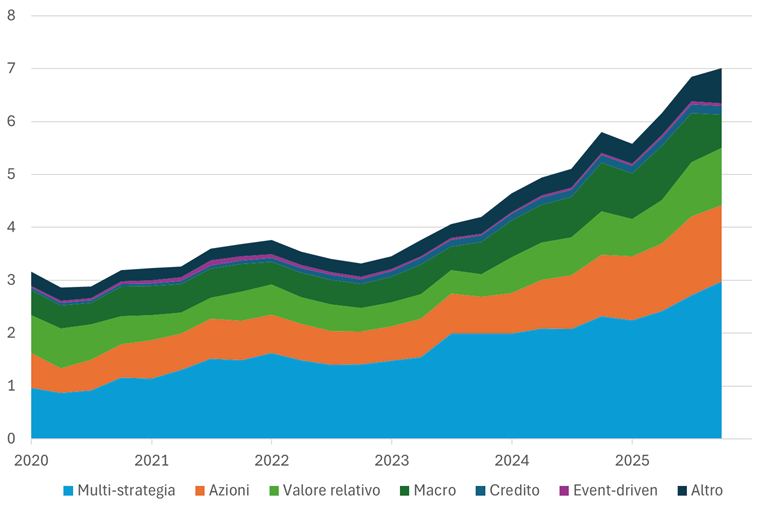
Fonte: U.S. Office of Financial Research.
Note: Include i prestiti concessi dai prime broker, i fondi raccolti per il tramite di contratti di pronti contro termine e altri debiti garantiti.
Figura 7
Patrimonio netto e leva finanziaria dei fondi speculativi
(migliaia di miliardi di dollari e rapporto fra attivi e patrimonio netto)
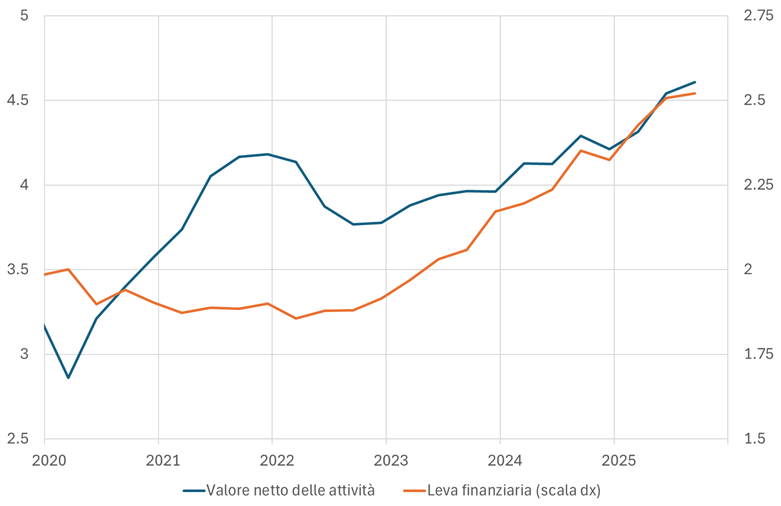
Fonte: U.S. Office of Financial Research e nostre elaborazioni.
Note: la leva finanziaria è calcolata dividendo la somma dei debiti e degli attivi netti di tutti i fondi appartenenti al campione per la somma dei loro attivi netti. Le statistiche mostrate in figura sono basata su nostre elaborazioni e dati raccolti dalla Securities and Exchange Commission relativamente a un campione di fondi operanti sul mercato statunitense. L'ultimo dato si riferisce a settembre 2025.
Figura 8
Leva finanziaria dei fondi speculativi per classe dimensionale
(rapporto fra attivi lordi e patrimonio netto; dati trimestrali)
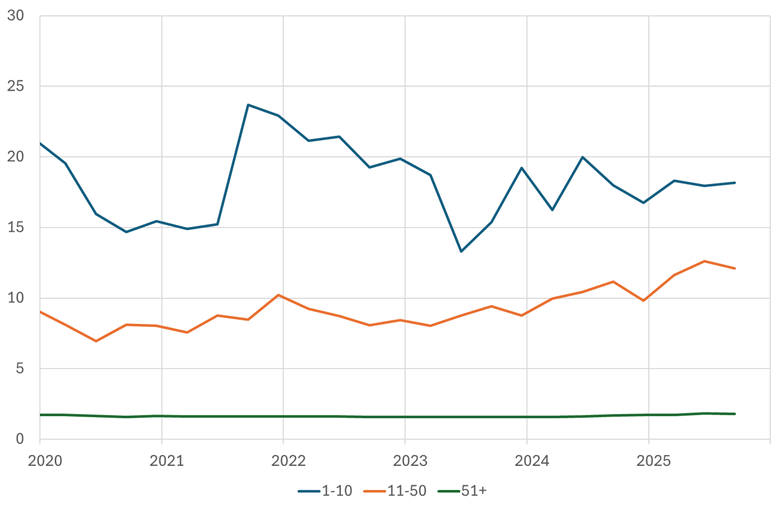
Fonte: U.S. Office of Financial Research.
Note: Media semplice dei rapporti di leva finanziaria dei singoli fondi inclusi in ciascuna categoria. Le categorie mostrate in legenda sono: i primi dieci fondi speculativi per dimensione degli attivi lordi (1-10); i successivi quaranta (11-50); tutti i restanti fondi censiti (50+).
Figura 9
Attivo dei fondi dei mercati dei capitali privati globali per comparto
(migliaia di miliardi di dollari)
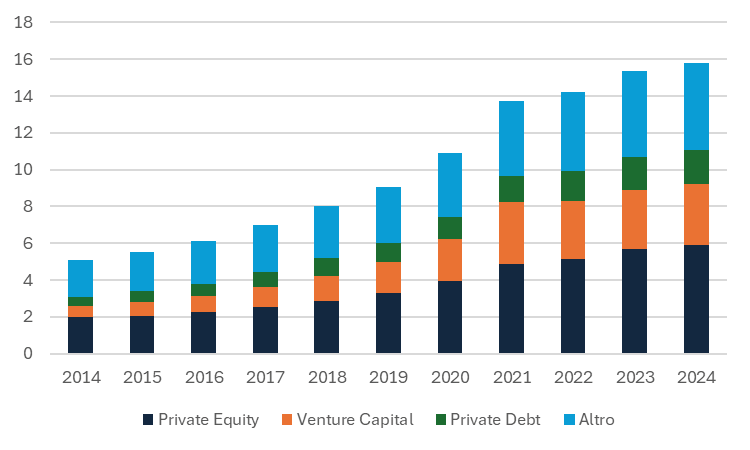
Fonte: PitchBook Data Inc.
Note: La categoria "altro" include i fondi di fondi (FoF) e quelli che investono in immobili e beni tangibili (infrastrutture e materie prime)
Figura 10
Capitalizzazione del mercato delle criptoattività
(miliardi di dollari; dati giornalieri)
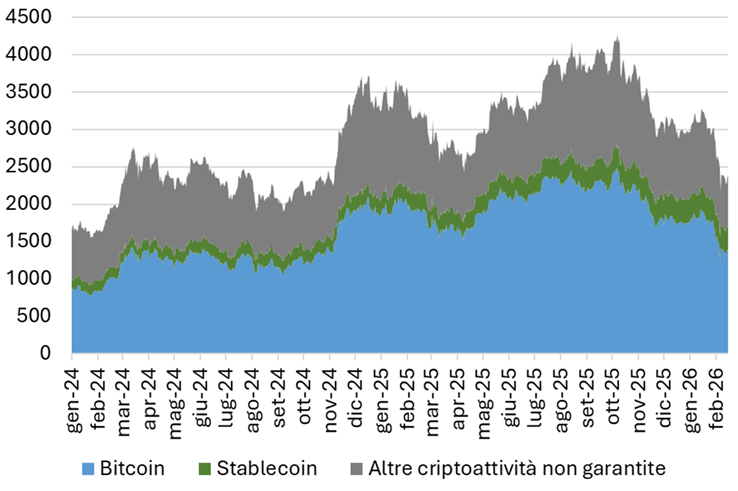
Fonte: Coinmarketcap
Figura 11
Prezzo del Bitcoin
(dollari; dati giornalieri)
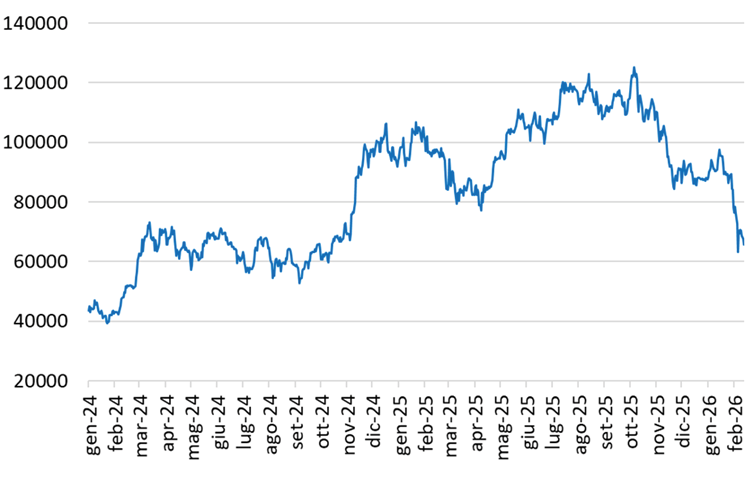
Fonte: Bloomberg e investing.com
Note
- * Ringrazio Claudia Biancotti, Alessandro Borin, Alessio De Vincenzo, Marco Taboga e Pietro Tommasino per il loro contributo alla preparazione di questo intervento.
- 1 Cfr. International Monetary Fund, Fiscal Monitor, Ottobre 2025.
- 2 Per gli Stati Uniti, cfr. Auerbach, A.J. e W. Gale (2025), "Then and Now: A Look Back and Ahead at the Federal Budget Threads", NBER Working Paper, n. 34455; Frankel, J. (2025), "How will unsustainable US debt end?" (https://www.jeffrey-frankel.com/2025/11/30/how-will-unsustainable-us-debt-end/).
- 3 In Giappone il rialzo dei rendimenti prosegue una tendenza in atto dal 2022 che riflette un contesto di maggiore crescita e inflazione dopo tre decenni di pressioni deflattive; nel periodo più recente vi ha contribuito l'annuncio di un ampio programma di espansione fiscale da parte del nuovo governo.
- 4 Cioè misure "coercitive" volte a stabilizzare il debito o ridurne il costo, quali obblighi di detenzione dei titoli pubblici, limiti ai movimenti di capitale, limiti massimi ai tassi di interesse, ristrutturazione non concordata del debito.
- 5 Un flusso costante e adeguato di nuovi titoli inoltre migliorerebbe le condizioni di finanziamento e la performance delle obbligazioni comuni UE già in essere; cfr. K. Pallara, M. Pericoli and P. Tommasino (2025), "Issuing European safe assets: how to get the most out of Eurobonds?", Banca d'Italia, Questioni di Economia e Finanza, n. 937.
- 6 Fondo Monetario Internazionale (2025), External Sector Report, IMF: Washington DC.
- 7 Bayoumi, T. e J.E. Gagnon (2025), The US trade deficit and foreign borrowing: how long can it continue? Peterson Institute for International Economics, Working Paper n. 14.
- 8 Il tasso di risparmio lordo dell'economia cinese è pari a circa il 45 per cento del PIL, oltre il doppio rispetto a quello dell'area dell'euro.
- 9 La recente risalita dell'avanzo di conto corrente riflette anche la riallocazione di risorse dal settore immobiliare, colpito dallo scoppio della bolla, verso la manifattura. I dati micro del database MAGIC dell'OCSE suggeriscono che i settori maggiormente sussidiati (pannelli solari, alluminio, acciaio e automotive) sono anche quelli con i maggiori guadagni di quota di mercato globale.
- 10 Panetta, F. (2025), "Considerazioni finali del Governatore sul 2024", Banca d'Italia.
- 11 L'aumento dei prezzi dei beni intermedi importati può ridurre la competitività; la compressione delle importazioni potrebbe essere compensata da una contrazione delle esportazioni, specie in presenza di capacità produttiva vincolata e mercato del lavoro teso; inoltre la riorganizzazione dei flussi di commercio internazionale può favorire la riallocazione delle esportazioni verso gli Stati Uniti da paesi soggetti a dazi inferiori. Cfr. Obstfeld, M. (2025), "The U.S. trade deficit: myths and realities", Brookings Papers on Economic Activity, BPEA Conference Draft, March 27-28, 2025. Obstfeld (2025).
- 12 Morgan Stanley (2026), "AI Imports in Overdrive, Macro and Micro Perspectives", Global Economic Briefing, February 4.
- 13 Un esempio emblematico è la crisi finanziaria asiatica del 1997-98, che colpì economie con ampi disavanzi di conto corrente e una forte dipendenza da finanziamenti esterni a breve termine. Cfr. Eichengreen, B., e P. Gupta (2016), "Managing sudden stops", World Bank Policy Research Working Papers 7639. Bank for International Settlements (2022), Annual Economic Report.
- 14 Obstfeld M. (2018), "Twenty-five years of global imbalances", In Sustaining Economic Growth in Asia, edited by Jérémie Cohen-Setton.
- 15 Bernanke, B. (2005), "The global saving glut and the US current account deficit", Remarks at the Sandridge Lecture, Virginia Association of Economists, Richmond, Virginia, March 10, 2005.
- 16 FMI (2025), "Emerging markets resilience: good luck or good policies?", Capitolo2 in World Economic Outlook October 2025; C. Allen e L. Juvenal (2025), "The role of currencies in external balance sheets", Journal of International Economics, Volume 157, September 2025.
- 17 Itskhoki O. e D. Mukhin (2025). "Tariffs, global imbalances, and the dollar", VoxEU.com, 7th November 2025; Z. Jiang, R.J. Richmond and T. Zhang (2025), "Convenience Lost", NBER Working Papers 33940. Bayoumi, T. and J.E. Gagnon (2025), "The US trade deficit and foreign borrowing: how long can it continue?", Peterson Institute for International Economics Working Paper 14.
- 18 D. Barth, D. Beltran, M. Hoops, J. Kahn, E. Liu, and M. Perozek (2025) "The Cross-Border Trail of the Treasury Basis Trade," FEDS Notes October 15, 2025, Board of Governors of the Federal Reserve System.
- 19 Financial Stability Oversight Council, 2025 Annual Report, U.S. Department of the Treasury.
- 20 L'espansione del ruolo degli hedge funds si è verificata mentre la capacità di intermediazione delle banche, vincolata da requisiti di leva stringenti, non cresceva in linea con il mercato dei titoli sovrani. È stato quindi previsto un parziale allentamento dei requisiti di leva per le banche. Cfr. U.S. Office of the Comptroller of the Currency, "Modifications to the Enhanced Supplementary Leverage Ratio Standards for U.S. Global Systemically Important Bank Holding Companies and Their Subsidiary Depository Institutions: Final Rule," OCC Bulletin 2025-41, November 25, 2025.
- 21 La carenza di informazioni dettagliate non ha consentito una piena valutazione del ruolo delle chiusure di posizioni a leva degli hedge funds durante le tensioni di mercato dell'aprile 2025, seguite all'introduzione di nuovi dazi USA.
- 22 La Direttiva AIFM non stabilisce limiti precisi alla leva, ma impone ai i gestori dei Fondi di Investimento Alternativi (FIA) di fissare un livello massimo di leva per ciascun FIA. I fondi con leva superiore al 300 per cento del NAV sono soggetti a rendicontazione rafforzati; in circostanze eccezionali, le autorità competenti possono imporre limiti aggiuntivi alla leva dei FIA.
- 23 Cfr. Slok, T., Shah, R., and Galwankar. S., (2025) "Outlook for private markets", Apollo Global Management.
- 24 Anche in Italia il settore è cresciuto: negli ultimi dieci anni gli attivi sono più che quadruplicati, superando i 40 miliardi di euro a metà 2024; il peso sul PIL resta tuttavia contenuto (circa il 2 per cento contro il 10 nell'area euro).
- 25 Ci si riferisce al fallimento delle società statunitensi First Brands e Tricolor Holdings.
- 26 Galbarz, M.-C., Lobbens, M., Marquardt, P., Villarreal Fraile, M.M. (2024), "Complex exposures to private equity and credit funds require sophisticated risk management", Supervision Newsletter.
- 27 "The rise and risk of private credit", Global Financial Stability Report, IMF (2024).
- 28 In Italia, i mercati dei capitali privati sono caratterizzati da una presenza significativa di intermediari esteri non vigilati dalla Banca d'Italia, con conseguenti limiti informativi.
- 29 Riguardo le criticità relative alle stablecoin, non trattate in questo intervento, si veda F. Panetta (2025), "The struggle to reshape the international monetary system: slow-and fast-moving processes", Banca d'Italia; Bank for International Settlements (2025), "Annual Economic Report".
- 30 Aerts,S. et al. (2025), "Just another crypto boom? Mind the blind spots", in European Central Bank, Financial Stability Review.
- 31 Ci si riferisce in particolare agli annunci di nuovi dazi statunitensi lo scorso ottobre; un nuovo episodio di "crash" si è verificato a inizio febbraio.
- 32 Negli Stati Uniti l'attenzione si è concentrata sul CLARITY Act, che dovrebbe definire il perimetro regolamentare delle criptoattività non garantite e la ripartizione delle responsabilità di supervisione tra le autorità di vigilanza. Un punto critico è rappresentato dalla possibile estensione alle piattaforme decentralizzate degli obblighi KYC (Know Your Customer), AML (Anti-Money Laundering), e CFT (Combating the Financing of Terrorism).
- 33 Nell'ultimo anno i volumi di scambio mensili di future sulle principali criptoattività (bitcoin, ether, solana, XRP) hanno oscillato tra 4.000 e 7.000 miliardi di dollari. Gli strumenti più negoziati sono i perpetual futures (perps), contratti future senza data di scadenza. La maggior parte dei perps è negoziata su Binance, OkX, Gate.io e Bybit.
- 34 Alcune piattaforme di trading accettano come margine solo stablecoin garantite da strumenti regolamentati; altre accettano attività digitali quali bitcoin, ether e token a bassa capitalizzazione, con prezzi estremamente variabili.
- 35 Tale pratica non è generalmente ammessa nei mercati regolamentati. Negli Stati Uniti, l'obbligo di quotazione bilaterale realistica è prevista dalla normativa SEC post-2010. Nell'UE, obblighi analoghi sono previsti dalla Direttiva MiFID II.
- 36 Alcune fonti molto usate di dati di prezzo (oracles) hanno diffuso dati errati; Anche il motore di pricing di Binance ha generato anomalie, incluso un temporaneo disallineamento della stablecoin algoritmica USDe.
 Instagram